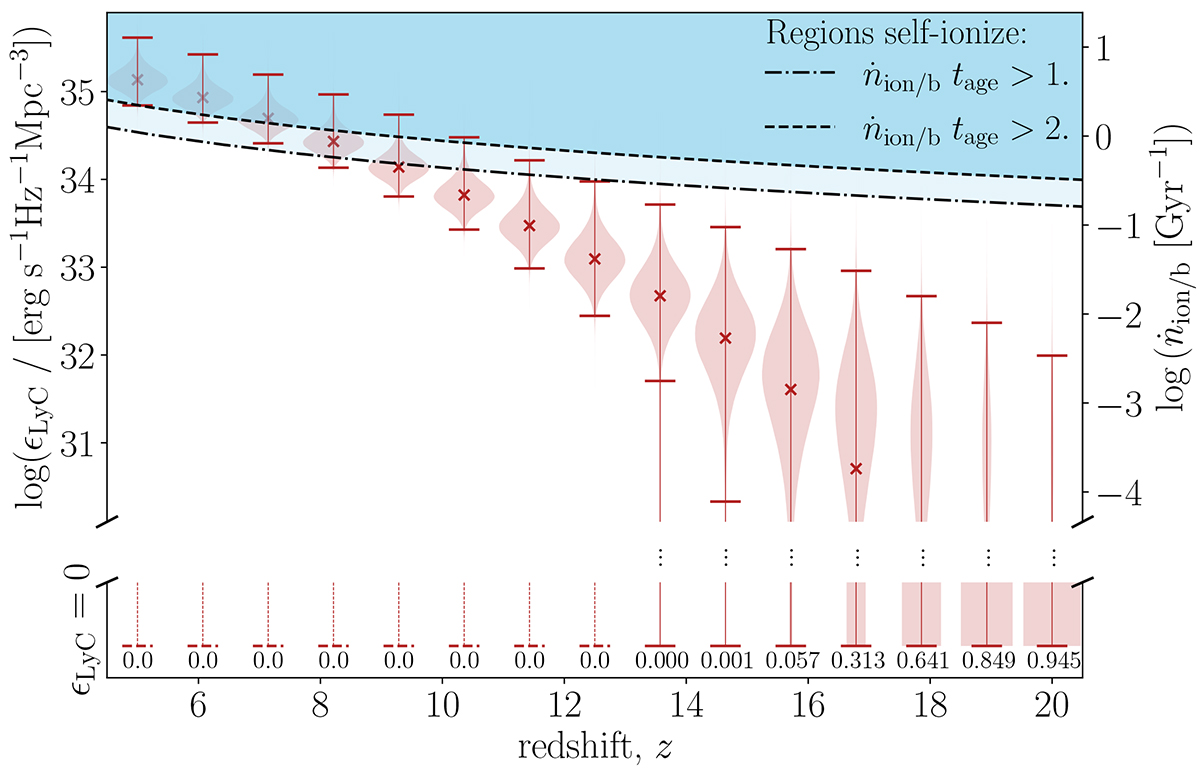
Fig. 5.
Download original image
Distribution of Lyman limit emissivities for regions with a radius of 5 cMpc. Violin plots correspond to the full emissivity PDFs, while the crosses and horizontal bars demarcate the mean and 99th percentiles, respectively. The rectangle on the bottom with the matching number represents the fraction of 5 cMpc regions with zero emissivity. On the left axis we show the specific emissivity at the Lyman limit, while on the right axis we show the corresponding number of ionizing photons (> 13.6 eV) per baryon per Gyr. The blue shaded region at the top demarcates the approximate criteria for a 5 cMpc to ionize: having an emissivity greater than one (dot dashed line) or two (dashed line) ionizing photons per baryon in the age of the Universe. Assuming a threshold value of two ionizing photons per stellar baryon (e.g., Bolton & Haehnelt 2007; Sobacchi & Mesinger 2014). we see that roughly half of 5 cMpc regions can self-ionize by z ∼ 7, consistent with the latest estimates of the EoR history e.g., Qin et al. in prep.
Current usage metrics show cumulative count of Article Views (full-text article views including HTML views, PDF and ePub downloads, according to the available data) and Abstracts Views on Vision4Press platform.
Data correspond to usage on the plateform after 2015. The current usage metrics is available 48-96 hours after online publication and is updated daily on week days.
Initial download of the metrics may take a while.