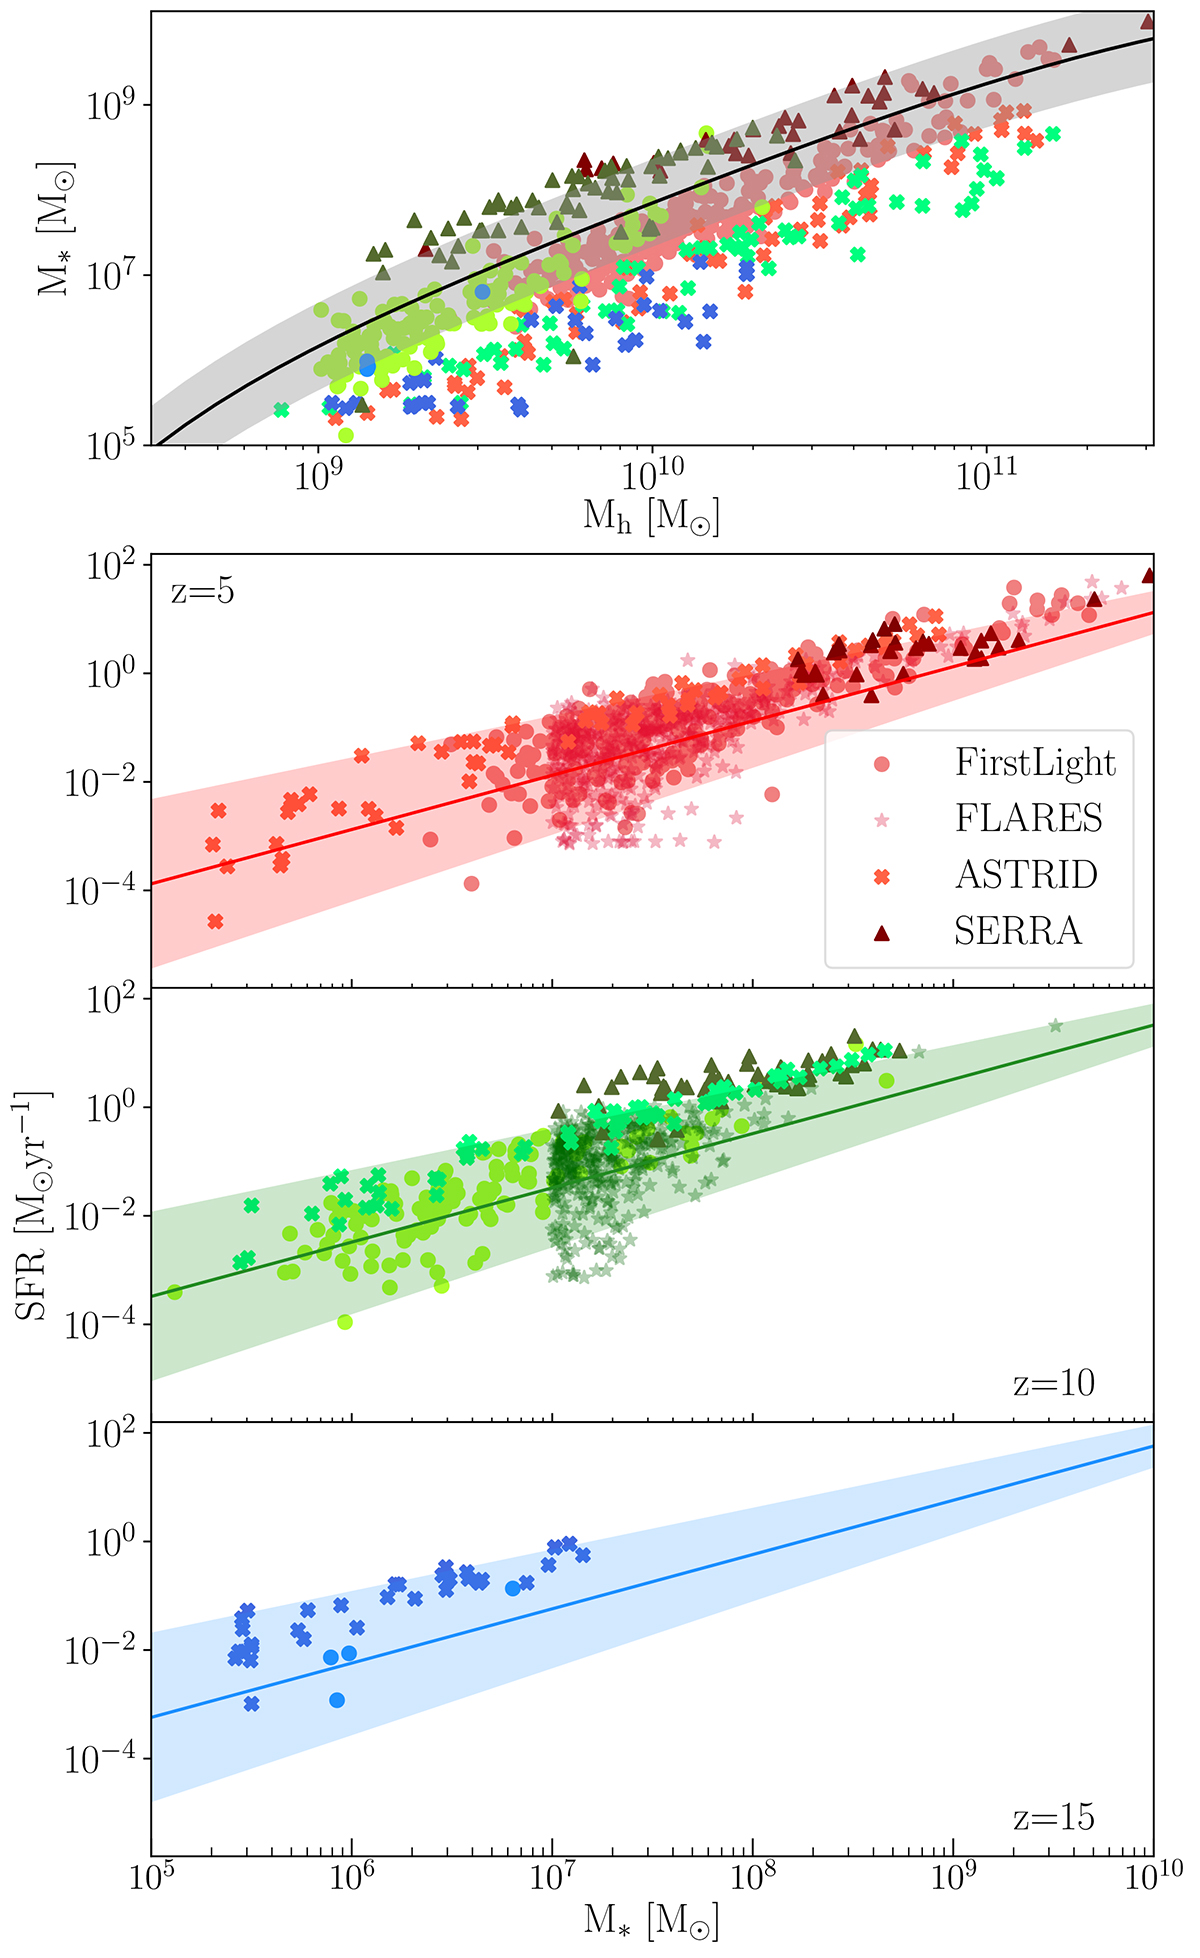
Fig. 2.
Download original image
Stellar-to-halo mass mass relation and star formation main sequence used in this work. Uppermost panel: Our (redshift independent) stellar to halo mass relation (solid curve) and 2σ scatter (shaded region). Lower panels: Galaxy star-forming main-sequence (solid curves) and 2σ scatter (shaded regions) at z = 5, 10, 15 (top to bottom). Coloured symbols represent galaxies from cosmological simulations, circles for FirstLight (Ceverino et al. 2018), stars for FLARES (Lovell et al. 2021), crosses for ASTRID (Bird et al. 2022; Davies et al. 2023) and triangles for SERRA (Pallottini et al. 2022). For ASTRID we randomly select galaxies in fixed mass bins, to avoid over crowding the plot, and for SERRA we use their z = 6 and z = 12 snapshots for z = 5 and 10, respectively.
Current usage metrics show cumulative count of Article Views (full-text article views including HTML views, PDF and ePub downloads, according to the available data) and Abstracts Views on Vision4Press platform.
Data correspond to usage on the plateform after 2015. The current usage metrics is available 48-96 hours after online publication and is updated daily on week days.
Initial download of the metrics may take a while.