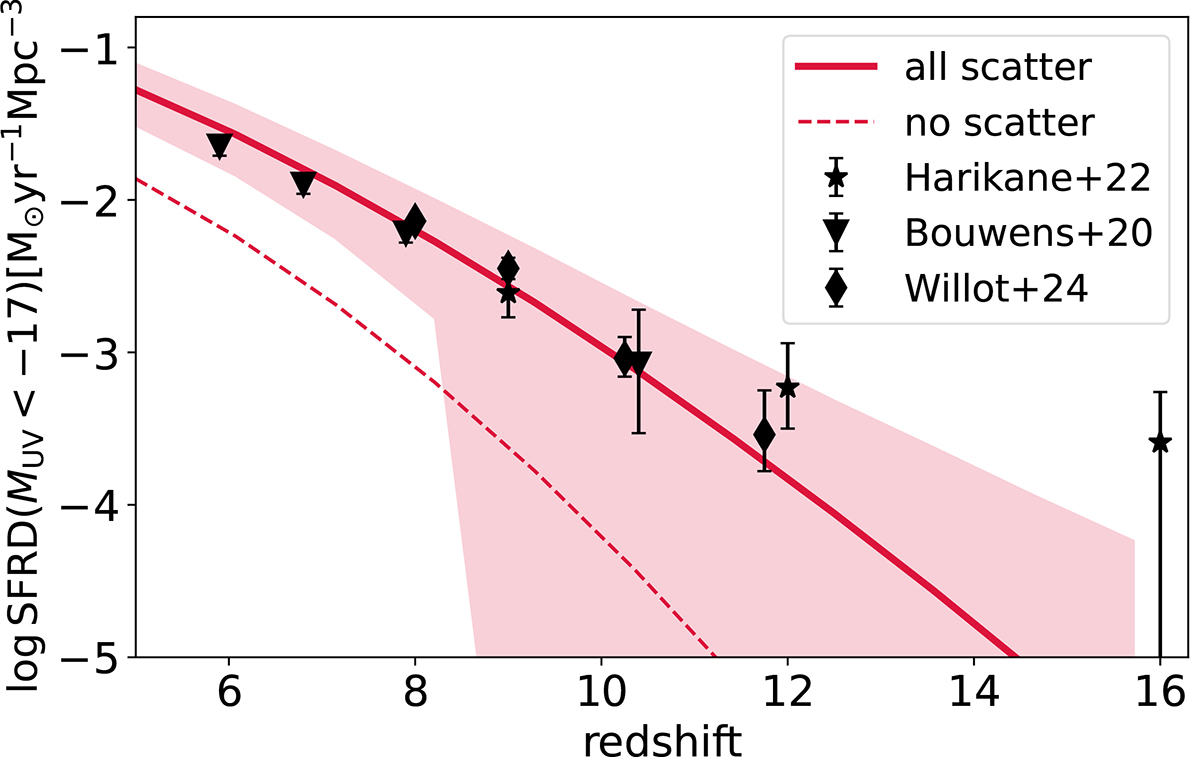
Fig. 13.
Download original image
Star formation rate density from bright galaxies (MUV < −17) as a function of density. Our fiducial model including all of the aforementioned sources of scatter is shown with the solid line and surrounding shaded regions (68% C.L.). The dashed line corresponds to the SFRD calculated using only mean relations without any scatter. Also shown are high-redshift estimates from Bouwens et al. (2020), Harikane et al. (2023), Willott et al. (2024).
Current usage metrics show cumulative count of Article Views (full-text article views including HTML views, PDF and ePub downloads, according to the available data) and Abstracts Views on Vision4Press platform.
Data correspond to usage on the plateform after 2015. The current usage metrics is available 48-96 hours after online publication and is updated daily on week days.
Initial download of the metrics may take a while.