Fig. 1.
Download original image
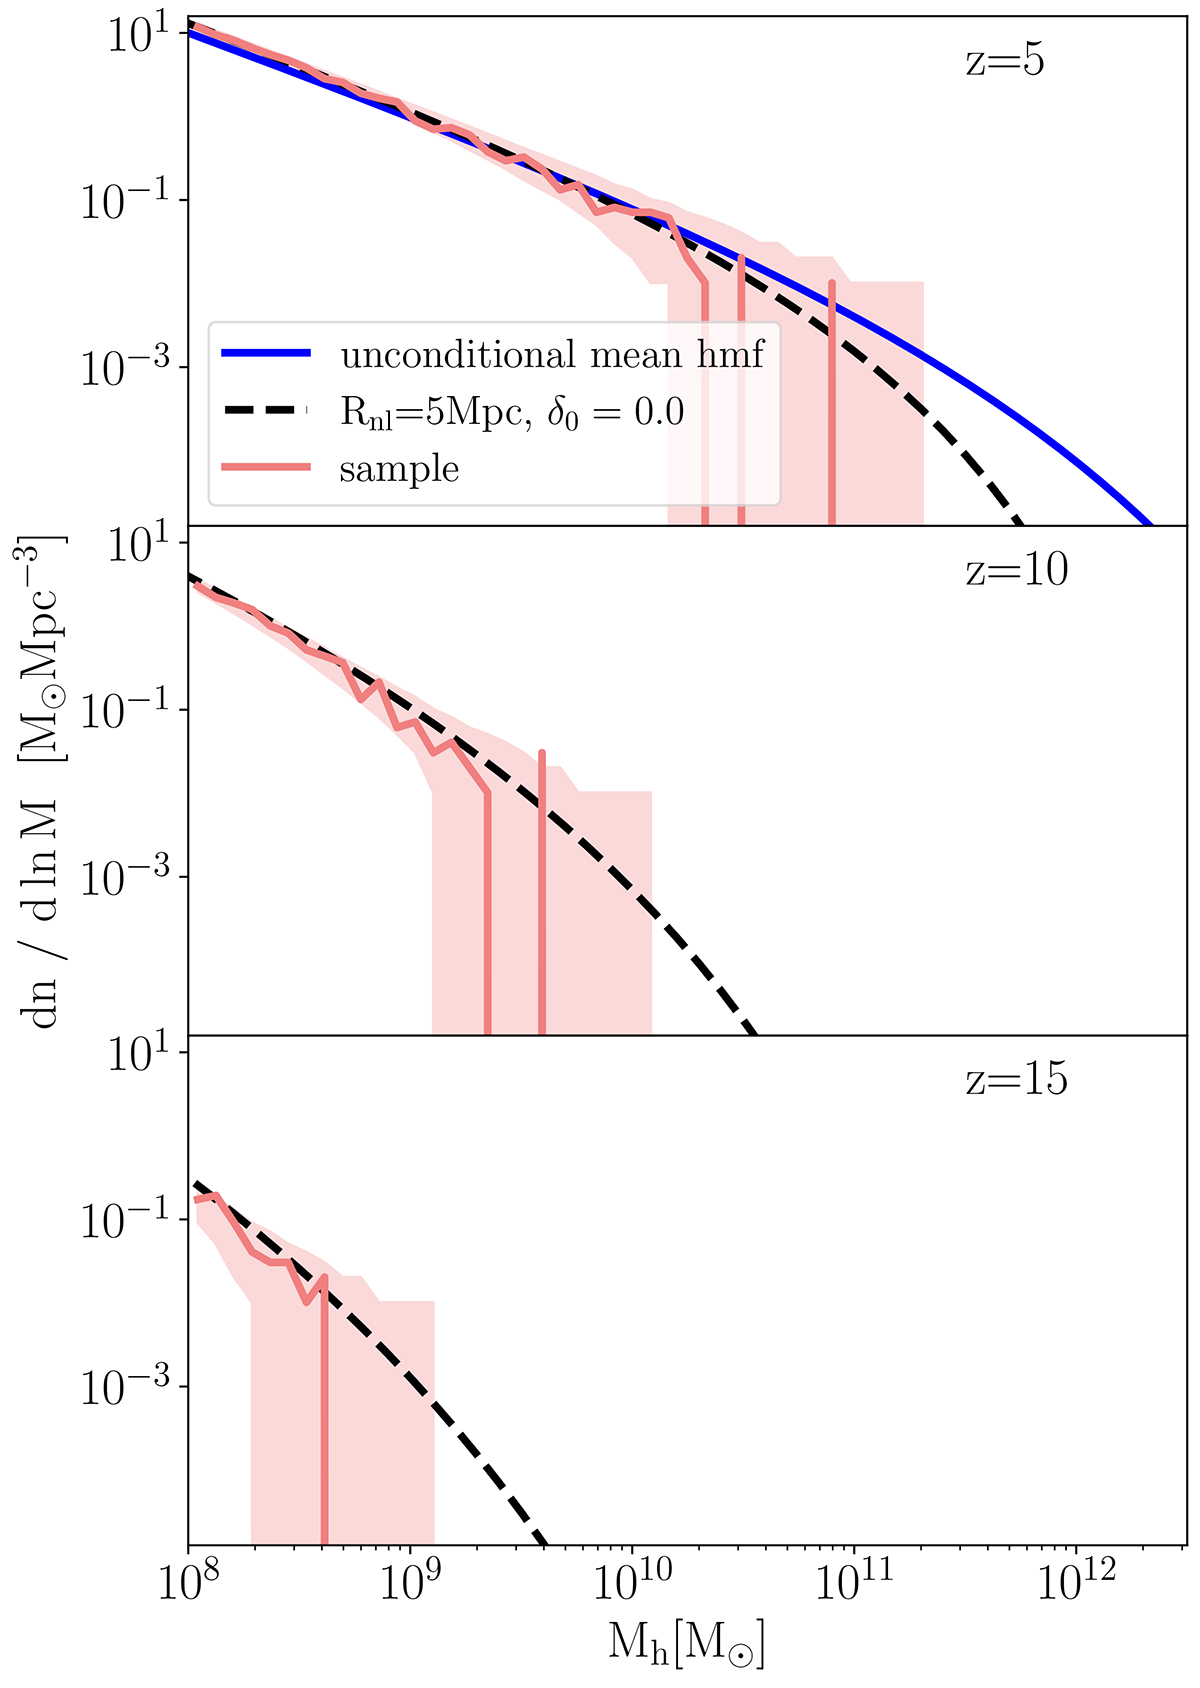
Example halo mass functions used in this work at three different redshifts. The dashed black curves and surrounding red regions correspond to the theoretical mean (Eq. (3)) and 95% C.L. of the halo field conditioned on a region of scale Rnl = 5 Mpc having a density equal to the cosmic average. The solid red curve corresponds to a single realization sampled from these distributions. The sample variance scatter in the red curve is seen to increase toward large masses and high redshifts, as the target mean values become smaller. In the top panel we also show in blue the non-conditional HMF (that is, the limit as R0 → ∞ at δ0 = 0).
Current usage metrics show cumulative count of Article Views (full-text article views including HTML views, PDF and ePub downloads, according to the available data) and Abstracts Views on Vision4Press platform.
Data correspond to usage on the plateform after 2015. The current usage metrics is available 48-96 hours after online publication and is updated daily on week days.
Initial download of the metrics may take a while.