Fig. 4.
Download original image
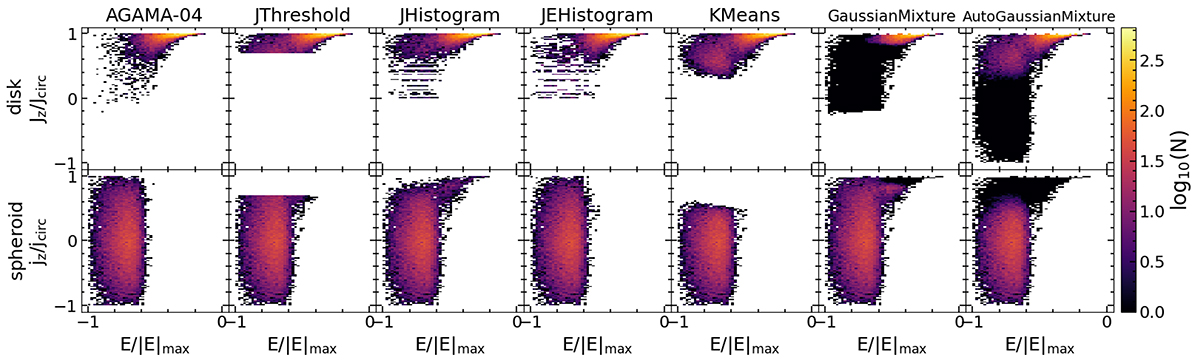
Distribution of stellar particles of the disk (first row) and spheroid (second row) of the AGAMA-04 galaxy in the normalized Lindblad diagram. The first column corresponds to the stellar particle distribution of the original disk and spheroid, while the remaining columns correspond to that obtained by each of the six methods. The color code represents the number of stellar particles in each region.
Current usage metrics show cumulative count of Article Views (full-text article views including HTML views, PDF and ePub downloads, according to the available data) and Abstracts Views on Vision4Press platform.
Data correspond to usage on the plateform after 2015. The current usage metrics is available 48-96 hours after online publication and is updated daily on week days.
Initial download of the metrics may take a while.