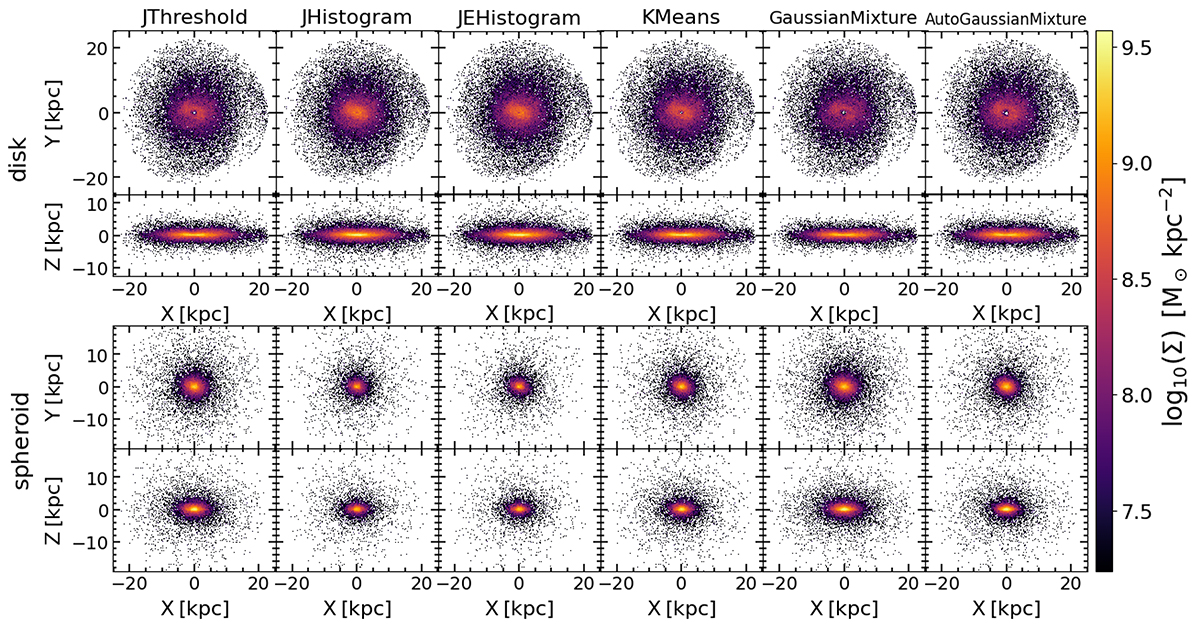
Fig. 11.
Download original image
Face-on and edge-on view of the surface mass distribution of the disk (first row) and spheroid (second row) corresponding to the IllustrisTNG galaxy. Each column corresponds to the stellar component distributions of the components obtained by the six dynamical decomposition methods implemented. The color scale represents the value of the surface mass density.
Current usage metrics show cumulative count of Article Views (full-text article views including HTML views, PDF and ePub downloads, according to the available data) and Abstracts Views on Vision4Press platform.
Data correspond to usage on the plateform after 2015. The current usage metrics is available 48-96 hours after online publication and is updated daily on week days.
Initial download of the metrics may take a while.