Fig. 1.
Download original image
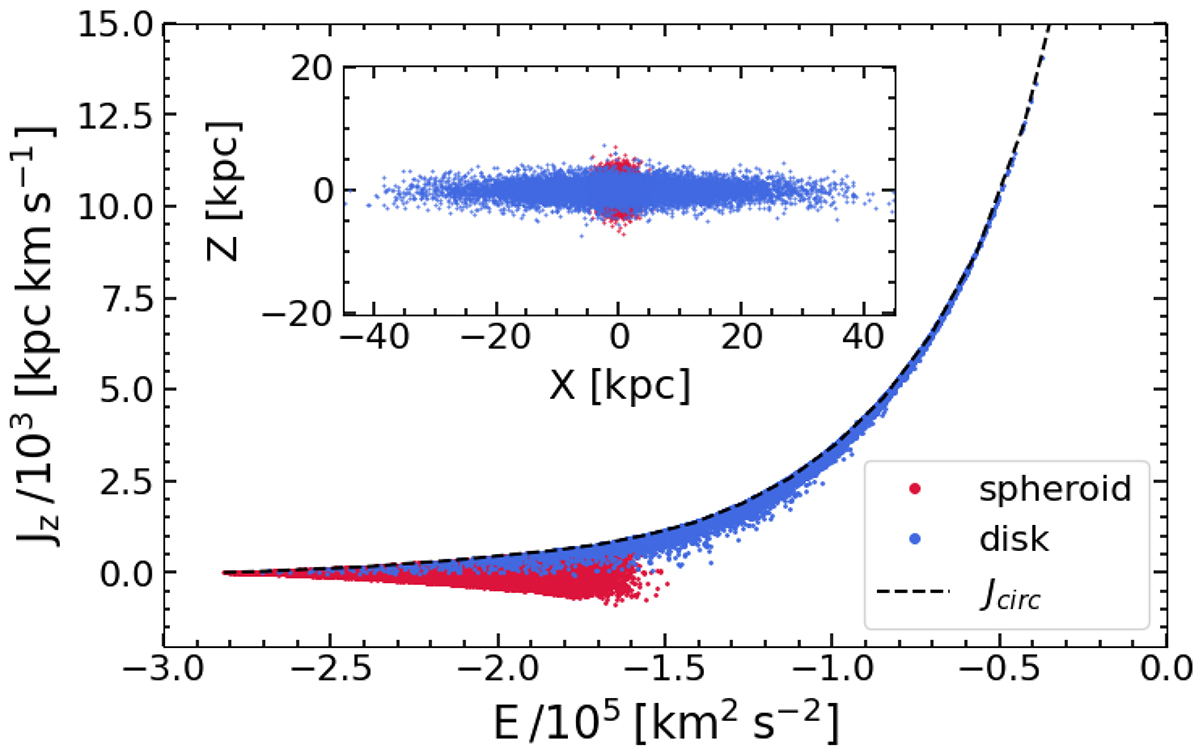
Lindblad diagram of a model galaxy in equilibrium (see galaxy model 04 in Table 1). The z-component of the angular momentum is shown as a function of the specific binding energy for all stellar particles. In red are represented the particles corresponding to the spheroid, while in blue are the stellar particles of the disk. The black dashed line is the Jcirc. The top inset shows the edge-on view of the galaxy to which the diagram belongs.
Current usage metrics show cumulative count of Article Views (full-text article views including HTML views, PDF and ePub downloads, according to the available data) and Abstracts Views on Vision4Press platform.
Data correspond to usage on the plateform after 2015. The current usage metrics is available 48-96 hours after online publication and is updated daily on week days.
Initial download of the metrics may take a while.