Open Access
Fig. 8
Download original image
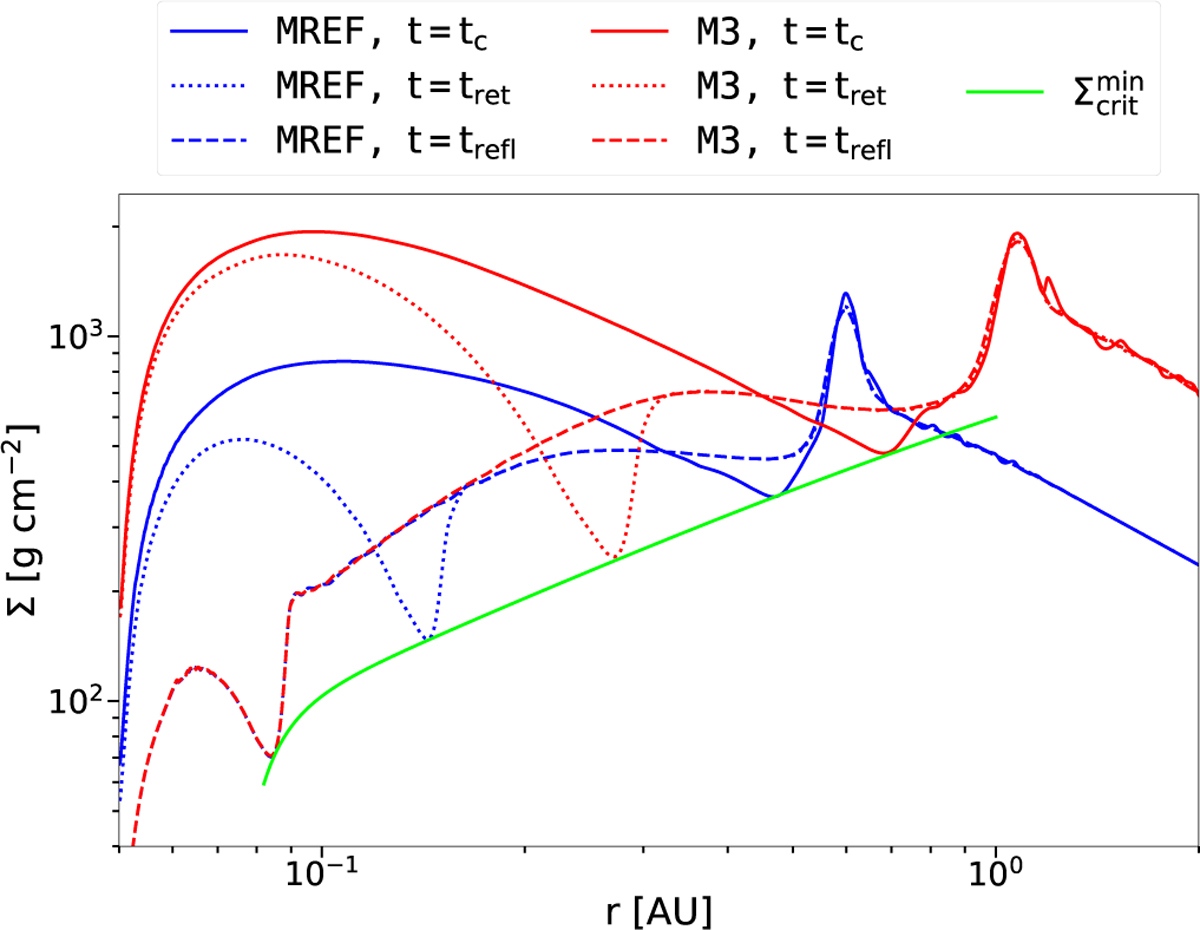
Surface density profiles of the models MREF and M3 for three points in time each. tc, tret and trefl correspond to the points in time described in Fig. 3. The fit for the minimum values of the surface density valley travelling alongside the cooling front ![]() at each radius is shown as a solid green line.
at each radius is shown as a solid green line.
Current usage metrics show cumulative count of Article Views (full-text article views including HTML views, PDF and ePub downloads, according to the available data) and Abstracts Views on Vision4Press platform.
Data correspond to usage on the plateform after 2015. The current usage metrics is available 48-96 hours after online publication and is updated daily on week days.
Initial download of the metrics may take a while.