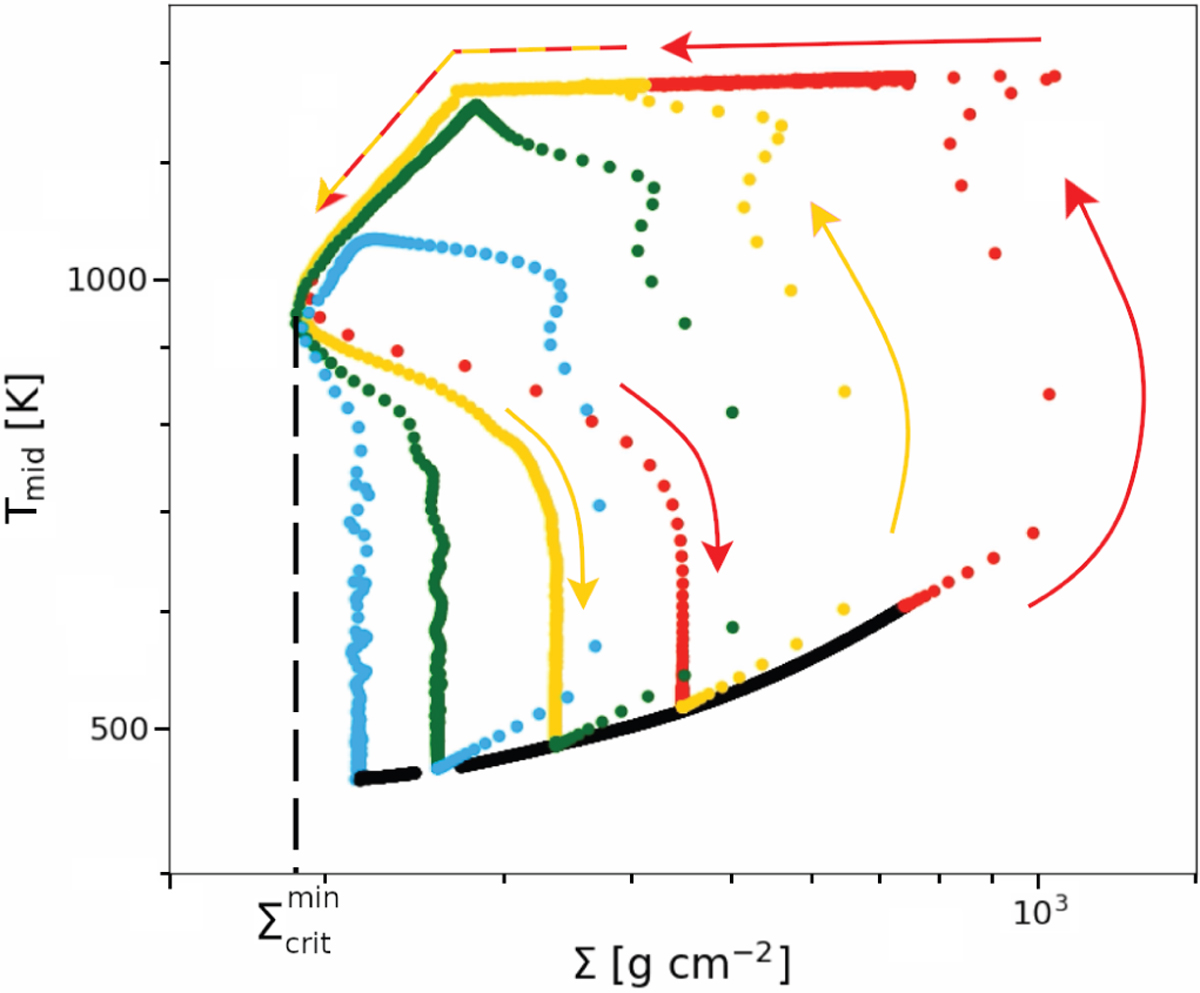
Fig. 7
Download original image
S-curve of the MREF model at a radius of 0.2 AU. The black line corresponds to the evolutionary track during the quiescent phase, while the coloured dots are taken from snapshots during the outburst stage. The red data points were extracted during the first outburst and the yellow, green and blue dots make up the evolutionary tracks during the first, second and third reflare, respectively. The density of the dots along an evolutionary track indicates the velocity at which the disc evolves. The arrows are exemplary for the first two cycles and indicate the direction in which the model evolves. The surface density value at which the disc switches from the upper branch (where α = αMRI) to the lower branch (where α = αDZ) is the same for each cycle and is marked with ![]() .
.
Current usage metrics show cumulative count of Article Views (full-text article views including HTML views, PDF and ePub downloads, according to the available data) and Abstracts Views on Vision4Press platform.
Data correspond to usage on the plateform after 2015. The current usage metrics is available 48-96 hours after online publication and is updated daily on week days.
Initial download of the metrics may take a while.