Fig. 6
Download original image
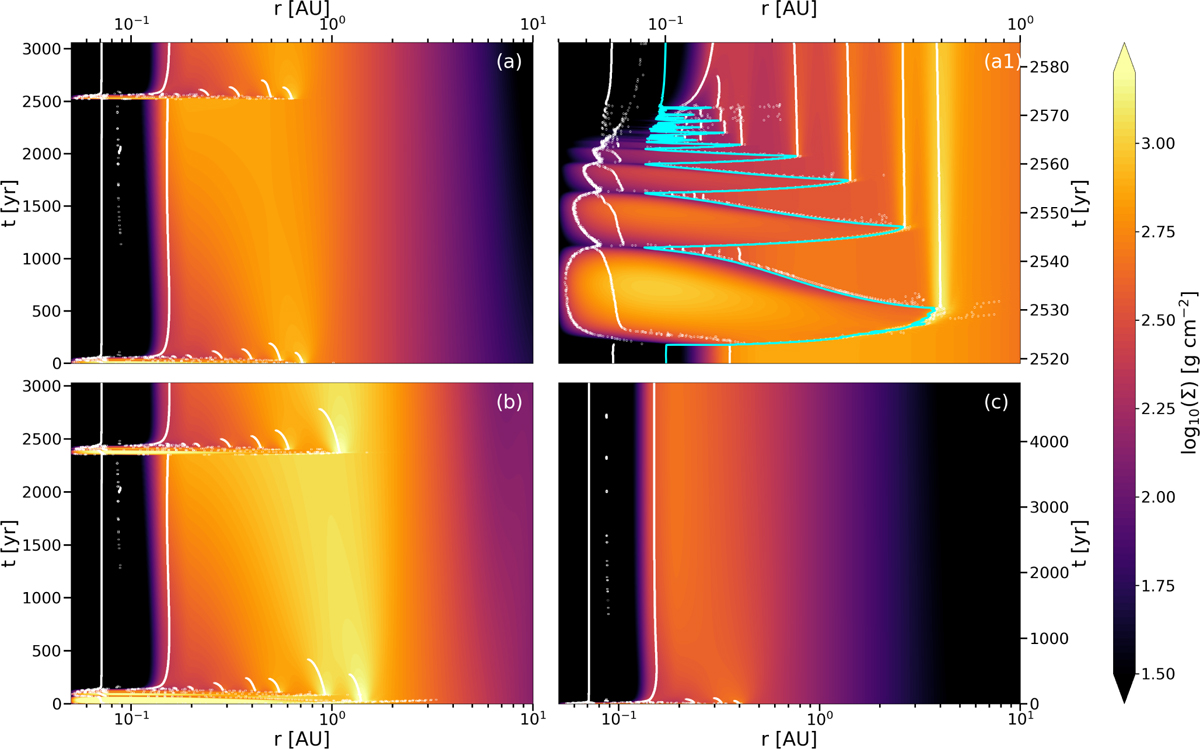
Space-time diagrams of MREF (panel a), M3 (panel b) and M2 (panel c) with the colours corresponding to the surface density at the respective locations and times. While a TI cycle develops within a 3000 yr time frame in the MREF and M3, the M2 model does not show signs of TI even after about 5000 yr and the disc has reached a quasi-steady state. The white contours indicate the positions of pressure maxima. Panel a1 shows the space-time diagram of the TI phase of the MREF model. The cyan contour line corresponds to the location of the inner edge of the dead zone at the midplane.
Current usage metrics show cumulative count of Article Views (full-text article views including HTML views, PDF and ePub downloads, according to the available data) and Abstracts Views on Vision4Press platform.
Data correspond to usage on the plateform after 2015. The current usage metrics is available 48-96 hours after online publication and is updated daily on week days.
Initial download of the metrics may take a while.