Fig. 4
Download original image
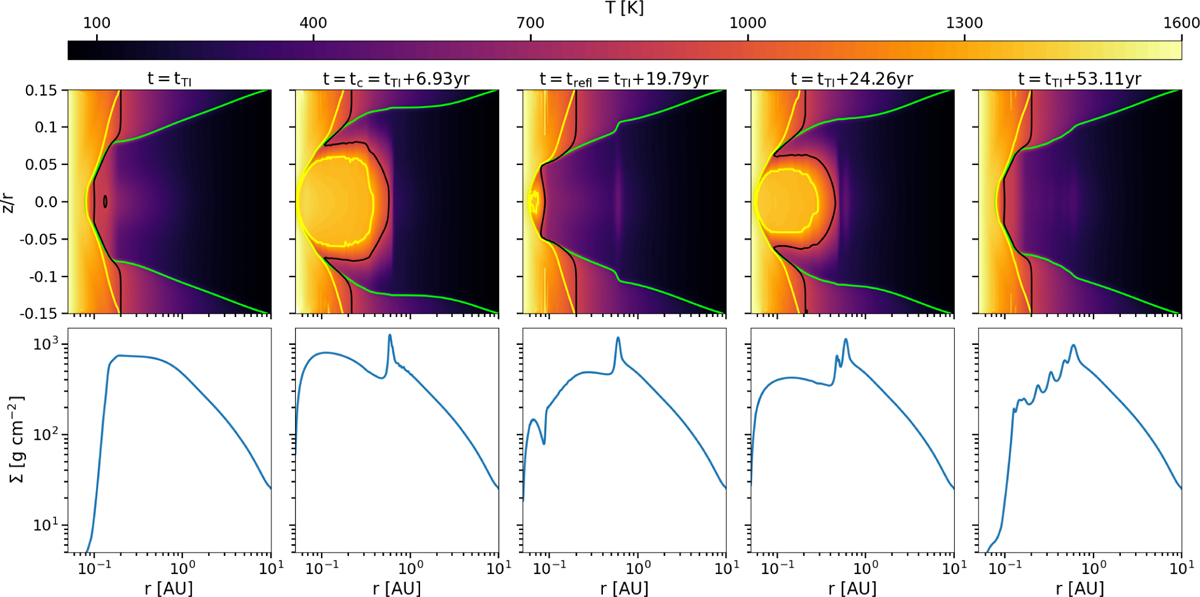
Temperature maps (upper row) and corresponding surface density profiles (lower row) for four snapshots in time during an outburst event. In the upper row, the black contour lines correspond to T = TMRI, the yellow ones to T = TS, and the green ones to a radial optical depth of τ* = 2/3. tTI is chosen to be the point in time at which the TI is triggered. The second column shows the state of the disc at the time the MRI active region has reached its largest extent during the main burst (tc). The third column represents the stage of the ignition of the first reflare (trefl), the maximum extent of which is reached at the time depicted in column four. The state of the disc shortly after the instability has ended is shown in column five.
Current usage metrics show cumulative count of Article Views (full-text article views including HTML views, PDF and ePub downloads, according to the available data) and Abstracts Views on Vision4Press platform.
Data correspond to usage on the plateform after 2015. The current usage metrics is available 48-96 hours after online publication and is updated daily on week days.
Initial download of the metrics may take a while.