Fig. 3
Download original image
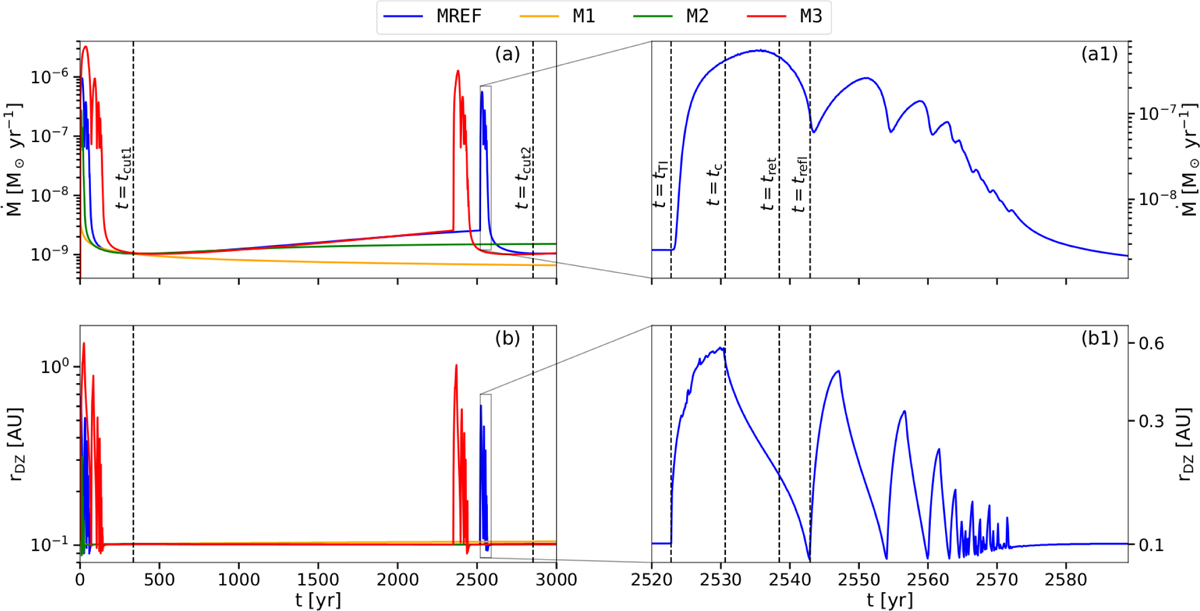
Evolution of the accretion rate (panel a) and the position of the dead zone inner edge at the midplane (panel b) for the four different models analysed in this work. Panels a1 and b1 show a zoom-in to the time frame in which the TI-induced accretion event is occurring in the MREF model. The vertical dashed lines in panel a1 indicate the times corresponding to the ignition of the TI (tTI), the heating front reaching its largest extent and a cooling front starting to develop (tc), the retreat of the cooling front towards the star (tret) and the ignition of the first reflare (trefl). In panel a, the vertical dashed lines mark the points in time for which the surface profiles of the MREF model in panels b (tcut1 ) and d (tcut2) of Fig. 2 are shown.
Current usage metrics show cumulative count of Article Views (full-text article views including HTML views, PDF and ePub downloads, according to the available data) and Abstracts Views on Vision4Press platform.
Data correspond to usage on the plateform after 2015. The current usage metrics is available 48-96 hours after online publication and is updated daily on week days.
Initial download of the metrics may take a while.