Fig. 2
Download original image
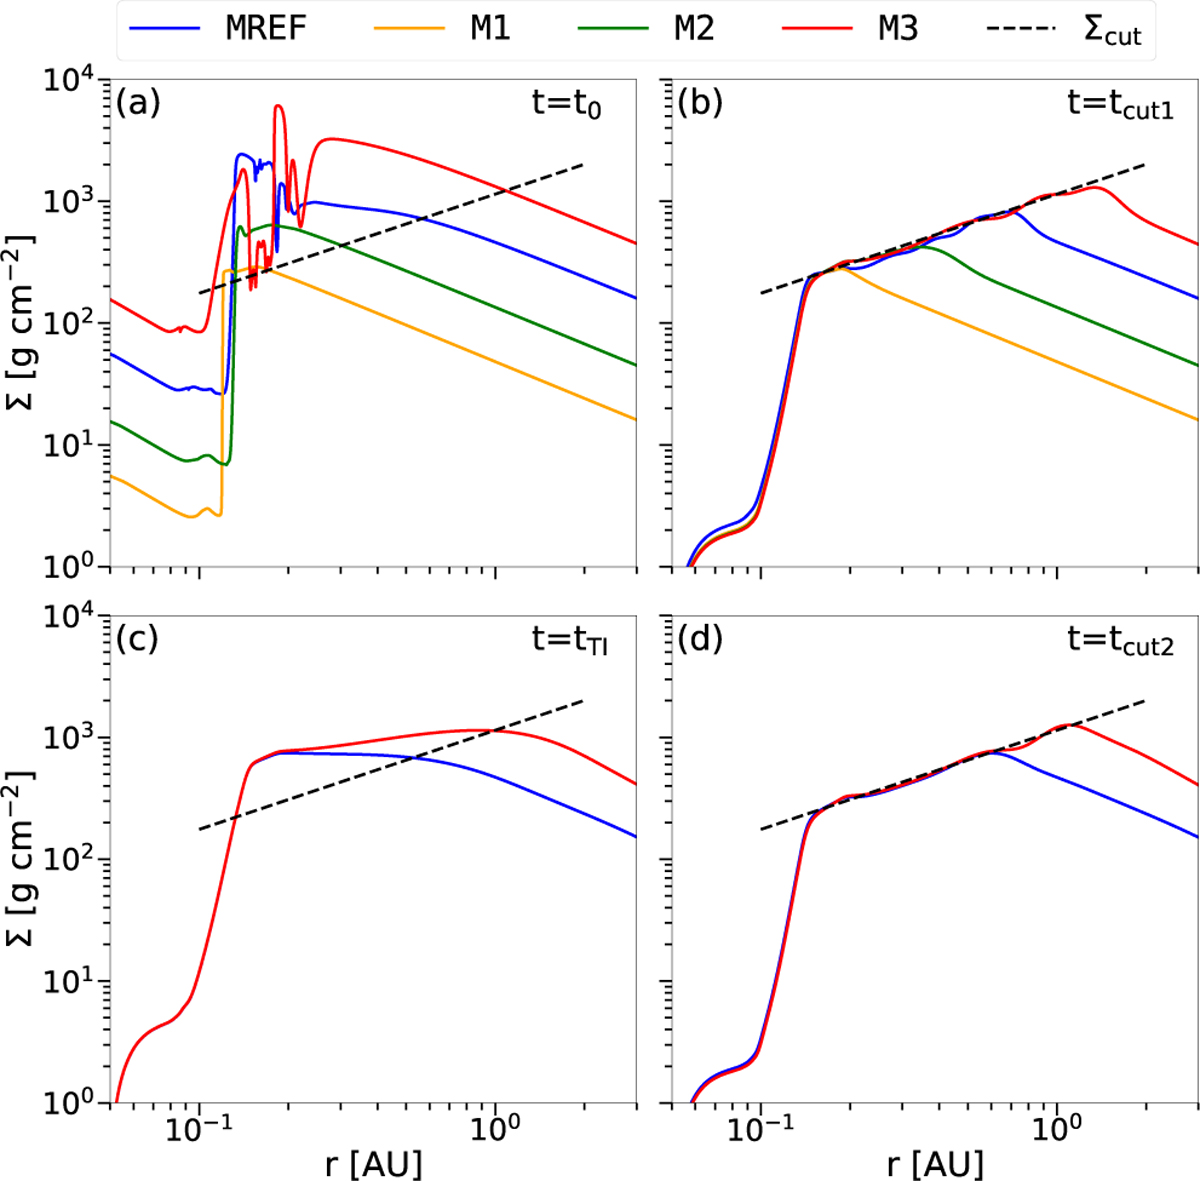
Surface density profiles of models with different Ṁint at distinct evolutionary stages. Panel a shows the initial configuration for all models, while panel b presents their structure after the first TI and the subsequent diffusion of the resulting density bumps. Panel c compares the surface density of MREF and M3 at the start of their respective second TI cycle, and panel d shows the structure of both models after they have become quiescent again (similar to panel b). In all cases, the TI phase persists until enough mass has been accreted so that the surface density does not exceed Σcut.
Current usage metrics show cumulative count of Article Views (full-text article views including HTML views, PDF and ePub downloads, according to the available data) and Abstracts Views on Vision4Press platform.
Data correspond to usage on the plateform after 2015. The current usage metrics is available 48-96 hours after online publication and is updated daily on week days.
Initial download of the metrics may take a while.