Fig. B.1
Download original image
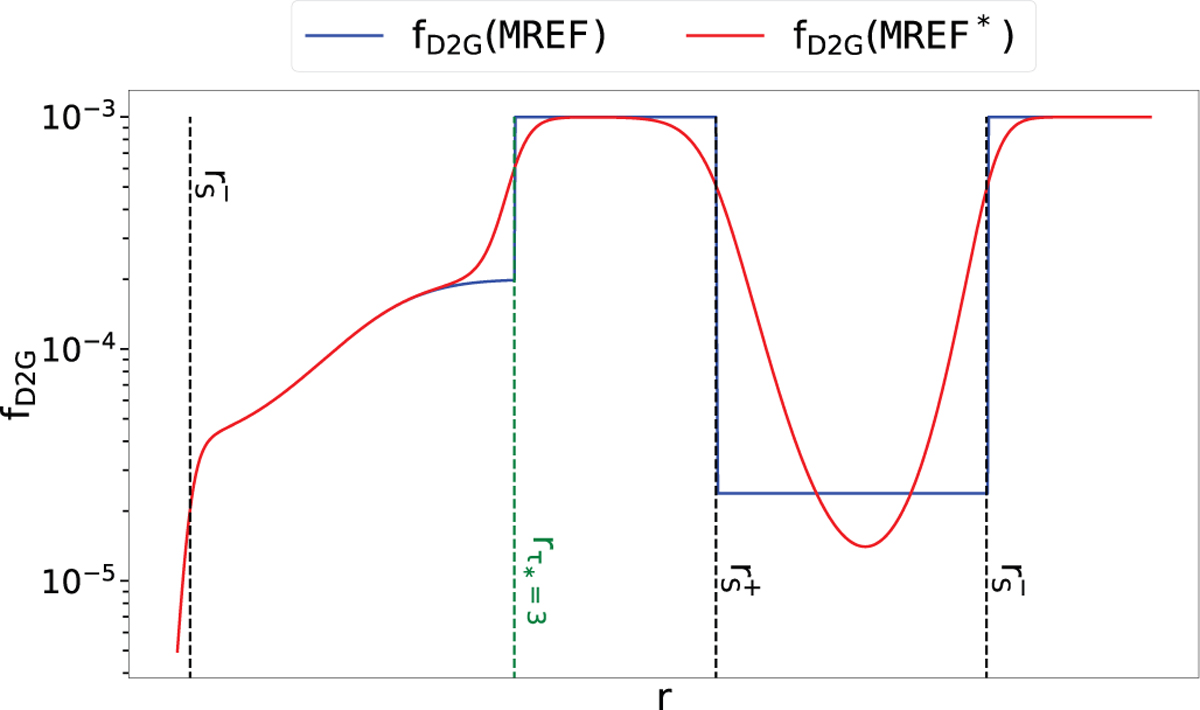
Schematic visualisation of the functions describing the dust-to-gas mass ratio in the MREF and MREF* models. For illustrative purposes, the density was held constant, representative profiles for the temperature and radial optical depth have been chosen and the models are shown as functions of a dimensionless radius. The vertical dashed black lines mark locations where the temperature crosses the dust sublimation temperature. ![]() and
and ![]() denote crossings with a negative and positive temperature gradient, respectively. The dashed green line represents the radius at which the radial optical depth is equal to three.
denote crossings with a negative and positive temperature gradient, respectively. The dashed green line represents the radius at which the radial optical depth is equal to three.
Current usage metrics show cumulative count of Article Views (full-text article views including HTML views, PDF and ePub downloads, according to the available data) and Abstracts Views on Vision4Press platform.
Data correspond to usage on the plateform after 2015. The current usage metrics is available 48-96 hours after online publication and is updated daily on week days.
Initial download of the metrics may take a while.