Fig. 10
Download original image
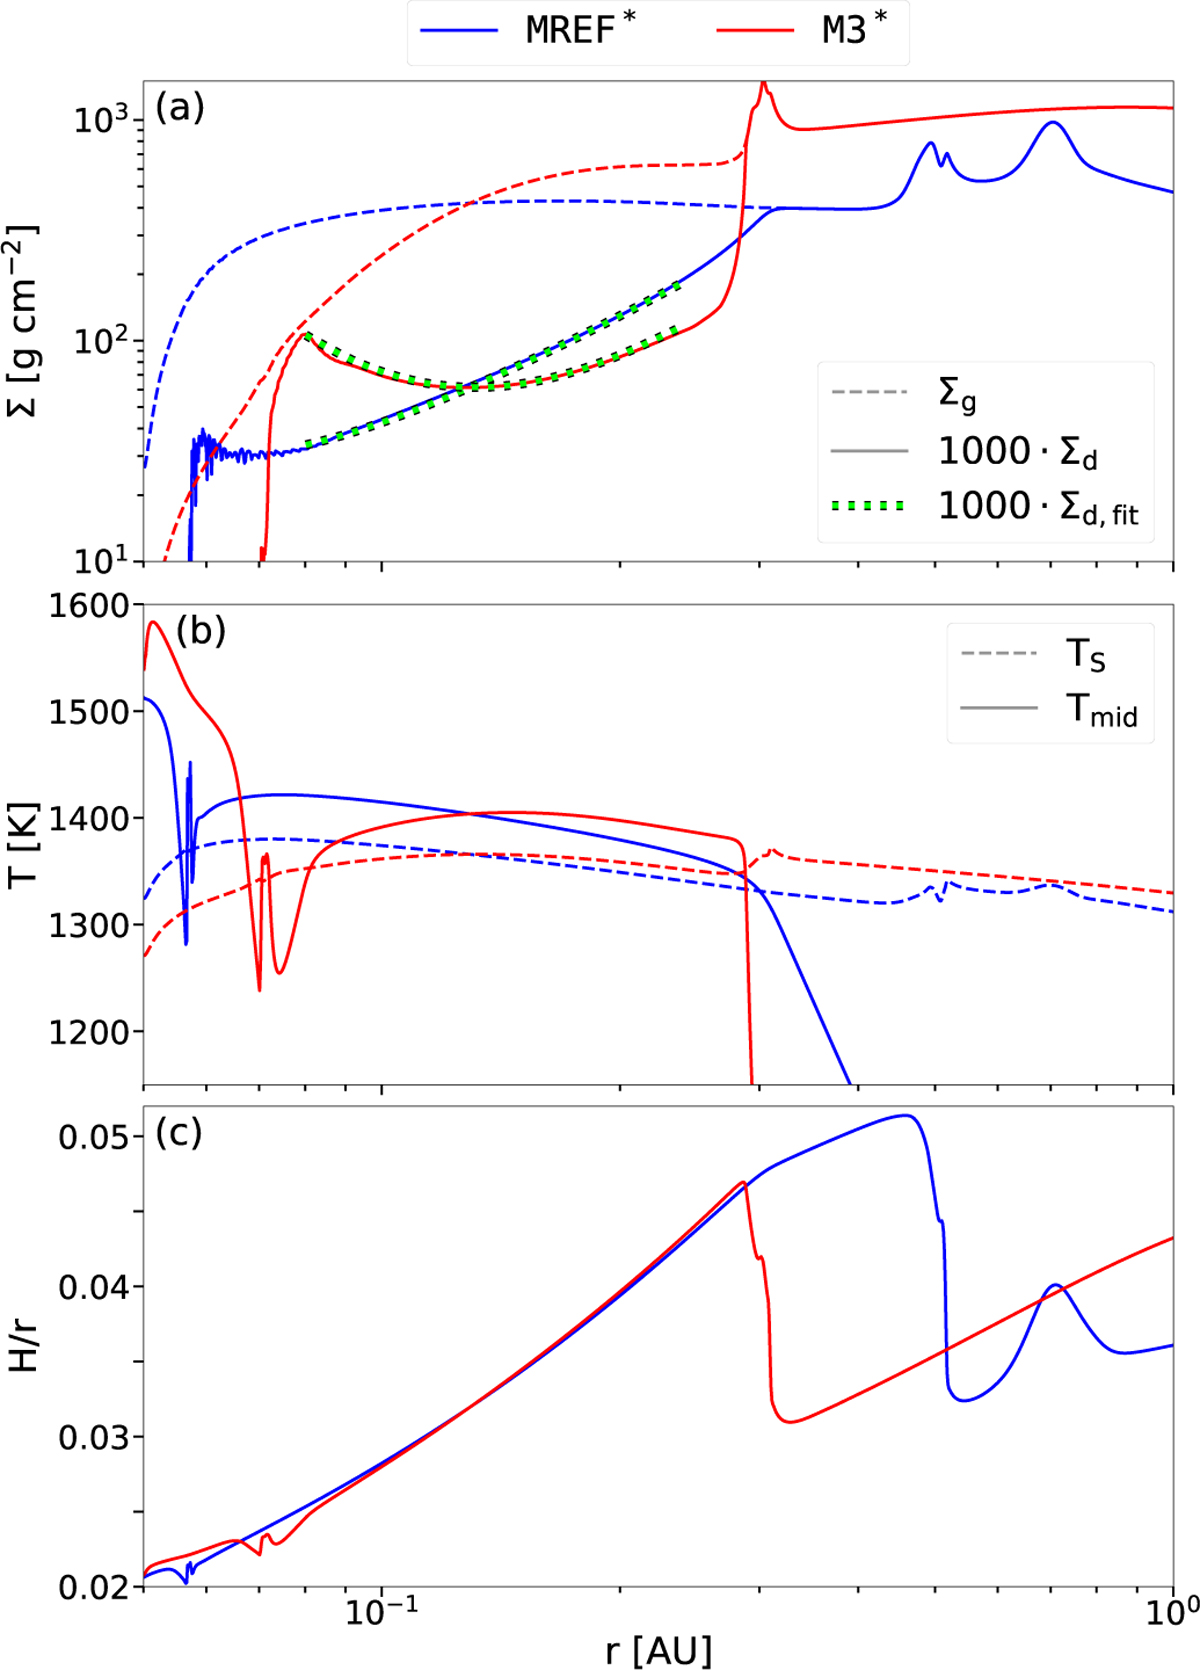
Radial proflies of the surface density (panel a), the temperature (panel b) and the pressure scale height (panel c) within 1 AU for one representative point in time each during the TI development in the MREF* and M3* models. In panel a, dashed lines represent the gas surface density, Σg, solid lines show the dust surface density, Σd, and the dotted lines depict the respective fits to the dust surface density, Σd,fit, in the high-state region, evaluated with Eq. (25). Σd and Ed,fit are multiplied by 1000 to compensate for the baseline dust-to-gas mass ratio ƒ0 and make the values comparable to Σg. The solid lines in panel b correspond to the midplane temperature, while the dashed lines represent the dust sublimation temperature.
Current usage metrics show cumulative count of Article Views (full-text article views including HTML views, PDF and ePub downloads, according to the available data) and Abstracts Views on Vision4Press platform.
Data correspond to usage on the plateform after 2015. The current usage metrics is available 48-96 hours after online publication and is updated daily on week days.
Initial download of the metrics may take a while.