Fig. 1
Download original image
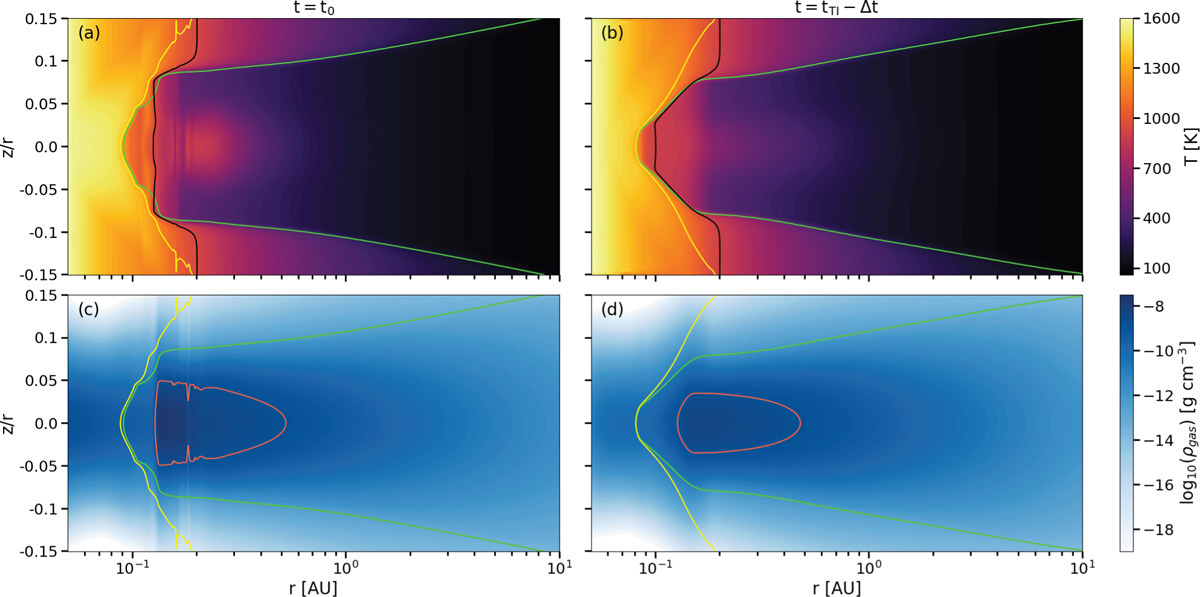
Temperature (panels a and b) and gas density (panels c and d) maps for the model MREF in the initial configuration at t = t0 and at the end of the quiescent phase, shortly before the TI is triggered, t = tTI − ∆t. Yellow contour lines depict the region of dust sublimation (T = Ts), black lines show the ionisation transition from the MRI active zone to the dead zone (T = TMRI), and green lines mark the radial optical depth τ, = 2/3 surface. In panels c and d, the red contours are drawn at ρgas = 10−9 which corresponds to a dust density of ρdust = 10−12.
Current usage metrics show cumulative count of Article Views (full-text article views including HTML views, PDF and ePub downloads, according to the available data) and Abstracts Views on Vision4Press platform.
Data correspond to usage on the plateform after 2015. The current usage metrics is available 48-96 hours after online publication and is updated daily on week days.
Initial download of the metrics may take a while.