Fig. 7.
Download original image
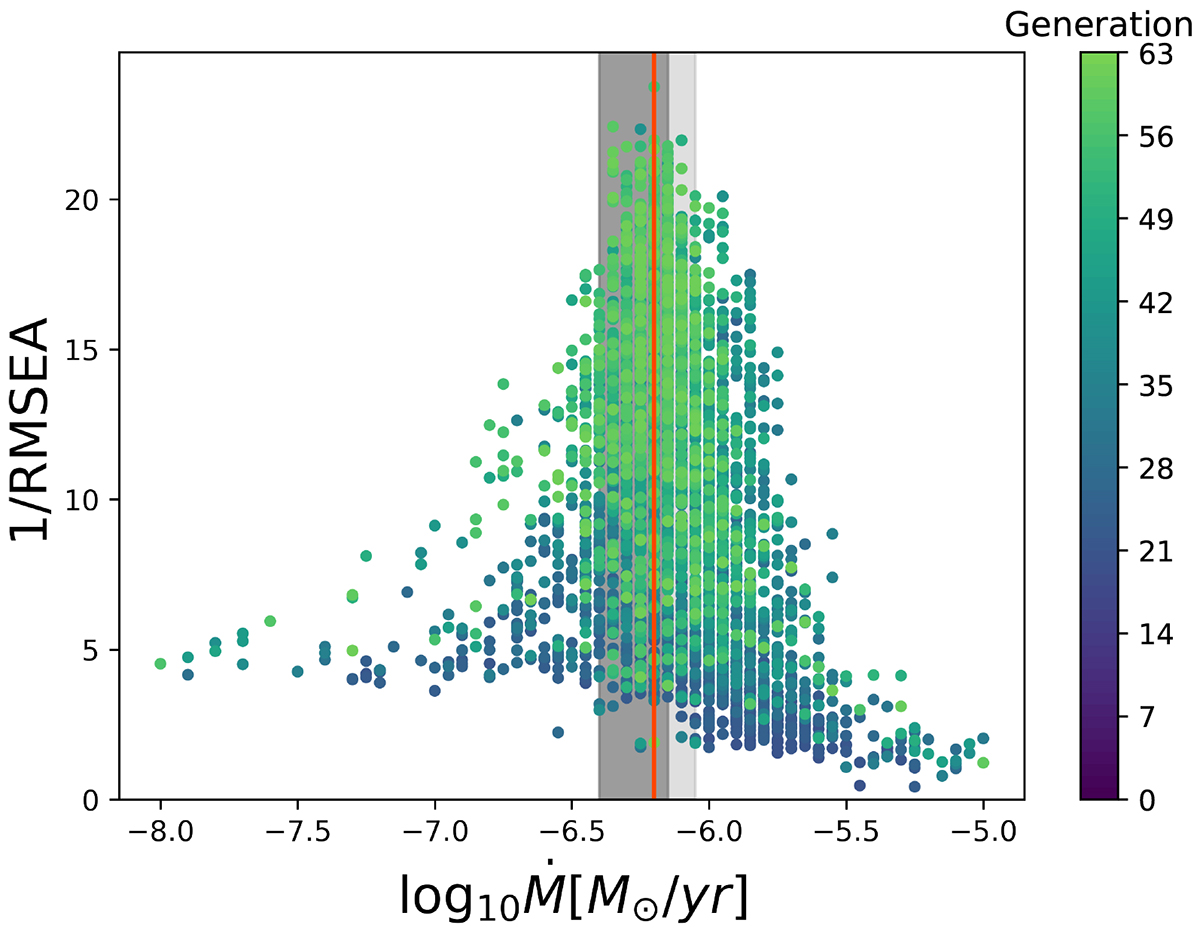
Quality of all models in a GA run ranked based on the inverse of the RMSEA value as a function of the mass-loss rate. The models for these plot are based on a run trying to fit the star Sk−68 ° 41 (SpT B0.7 Ia). Each point here is a separate model where the colour defines the generation in which this model was run. The dark grey region highlights the 1-σ uncertainty interval and the light grey region is the 2-σ uncertainty.
Current usage metrics show cumulative count of Article Views (full-text article views including HTML views, PDF and ePub downloads, according to the available data) and Abstracts Views on Vision4Press platform.
Data correspond to usage on the plateform after 2015. The current usage metrics is available 48-96 hours after online publication and is updated daily on week days.
Initial download of the metrics may take a while.