Fig. 6.
Download original image
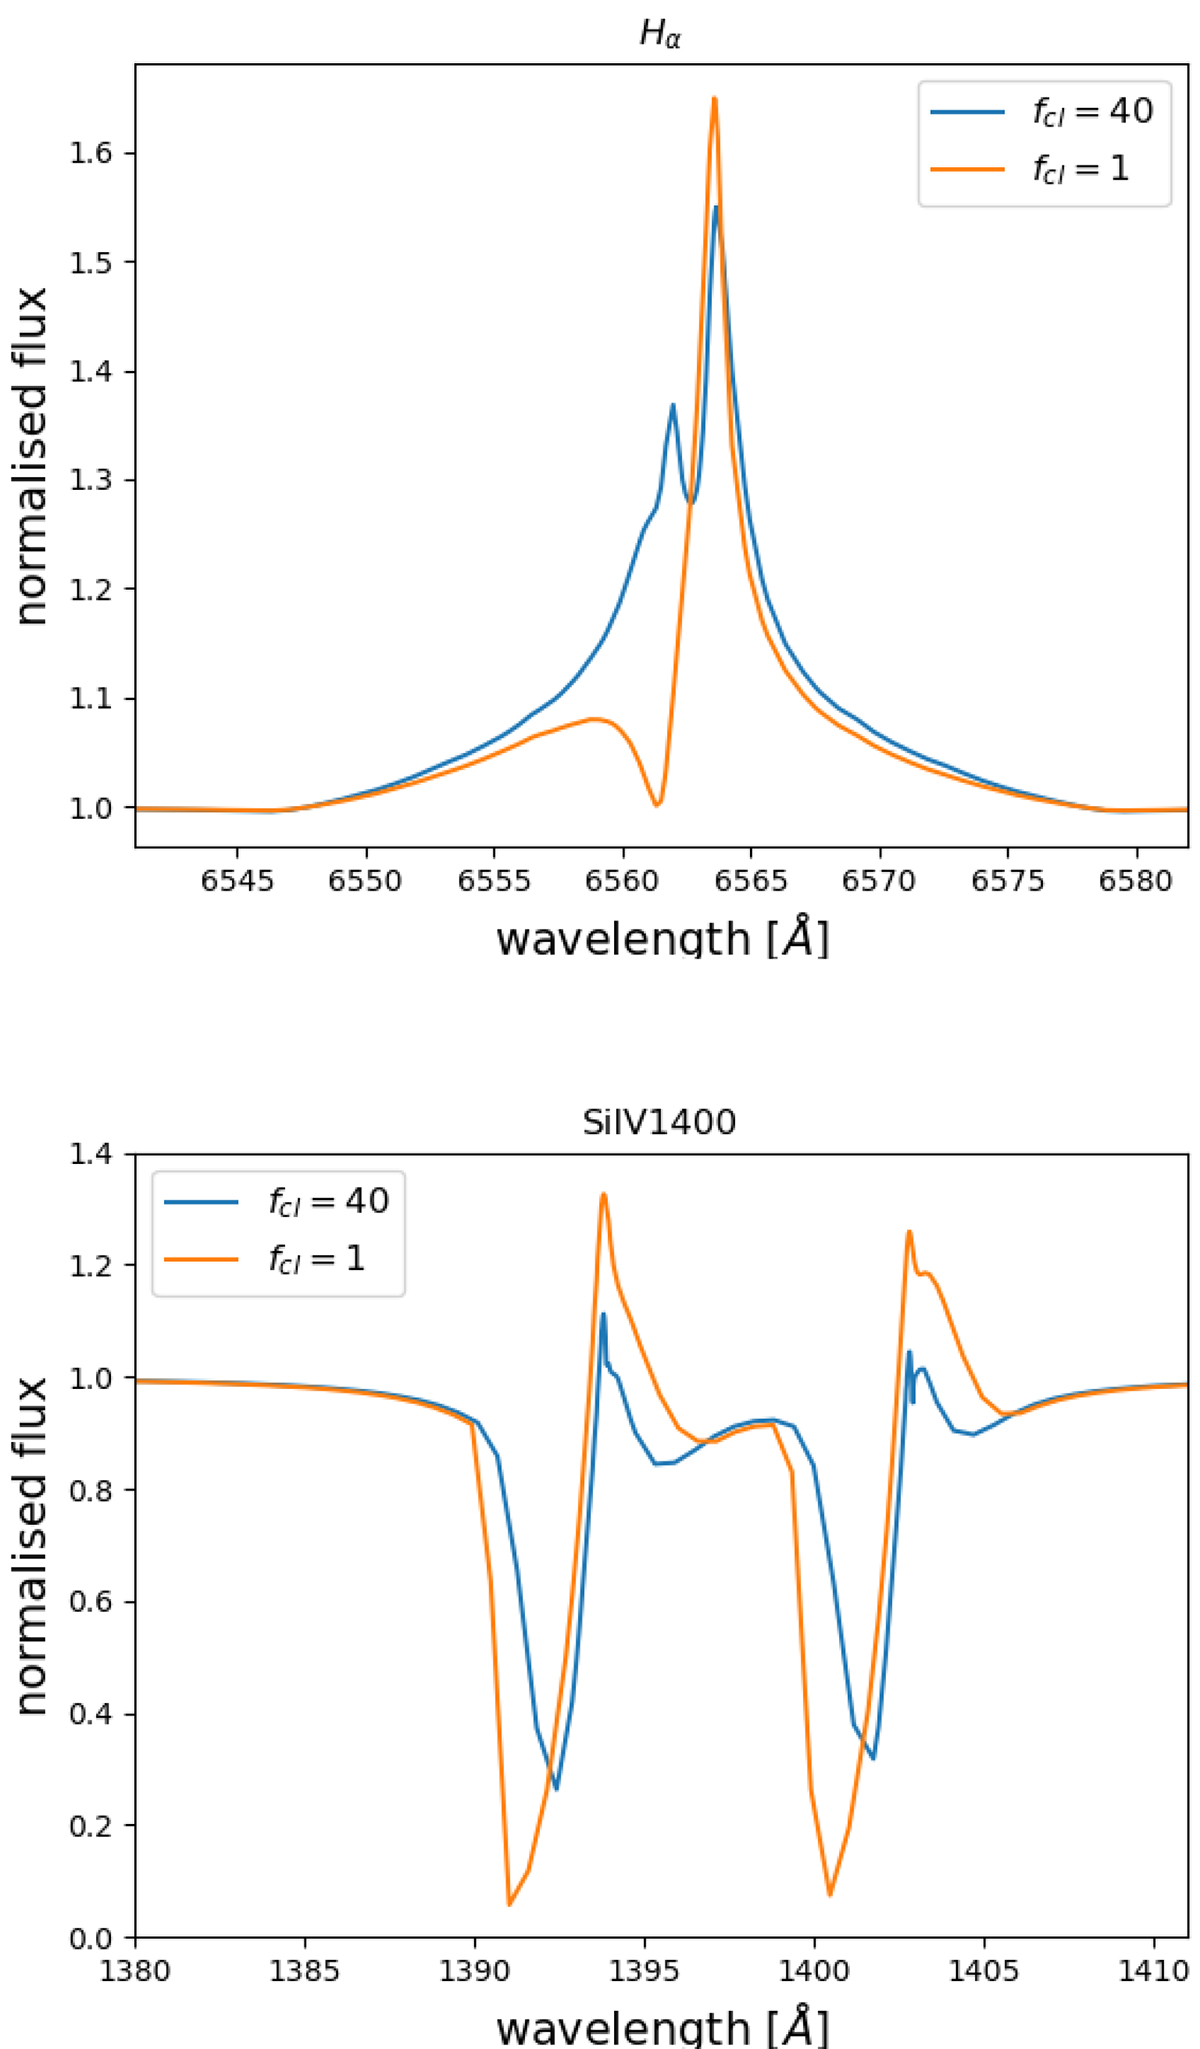
Clumping influence on the spectral lines. The figures show the influence a change in fcl has on the line profile of on one hand the H α recombination line and on the other hand the Si IV 1400 resonance doublet. Both model spectra are using almost the same input, they only differ in mass-loss rate and clumping. The blue line both has Ṁ = 8 · 10−8 M⊙/yr, and is highly clumped (fcl = 40). The orange line is a smooth outflow but has a significantly higher mass-loss rate (Ṁ = 5 · 10−7 M⊙/yr); the product ![]() is thus the same for both lines. If we assume an optically thin clumping over the complete line forming region, the 2 H α lines would show perfect agreement. However, this is not the case as we use models that relax the optically thin assumption and are only clumped above a fitted onset-velocity.
is thus the same for both lines. If we assume an optically thin clumping over the complete line forming region, the 2 H α lines would show perfect agreement. However, this is not the case as we use models that relax the optically thin assumption and are only clumped above a fitted onset-velocity.
Current usage metrics show cumulative count of Article Views (full-text article views including HTML views, PDF and ePub downloads, according to the available data) and Abstracts Views on Vision4Press platform.
Data correspond to usage on the plateform after 2015. The current usage metrics is available 48-96 hours after online publication and is updated daily on week days.
Initial download of the metrics may take a while.