Fig. 4.
Download original image
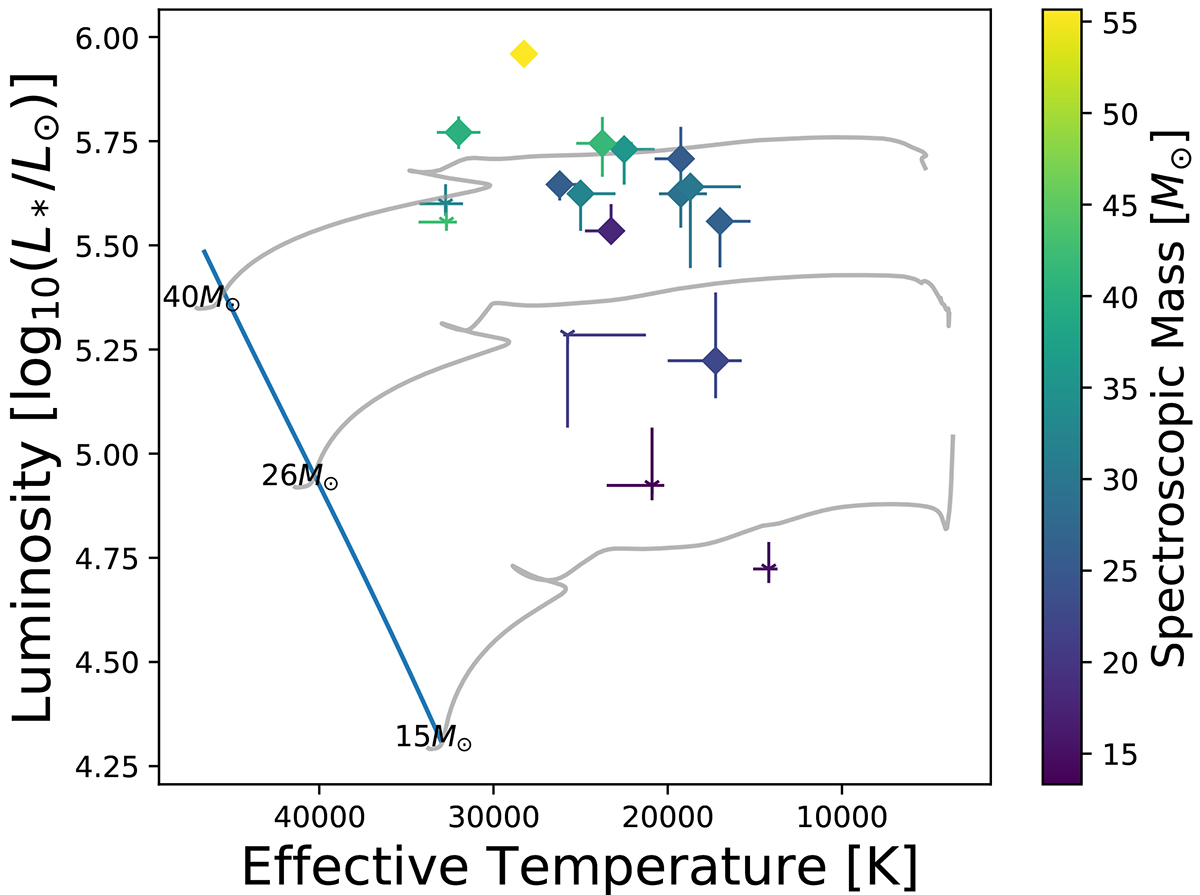
Hertzsprung–Russell diagram showing all stars in the sample and with the colour showing the derived spectral masses. The diamonds mark all the stars with spectral types Ia, while the ‘v’ symbols mark the lower luminosity classes. The stellar evolution tracks are from the MIST data base without any rotation (Dotter 2016; Choi et al. 2016; Paxton et al. 2010, 2013, 2015).
Current usage metrics show cumulative count of Article Views (full-text article views including HTML views, PDF and ePub downloads, according to the available data) and Abstracts Views on Vision4Press platform.
Data correspond to usage on the plateform after 2015. The current usage metrics is available 48-96 hours after online publication and is updated daily on week days.
Initial download of the metrics may take a while.