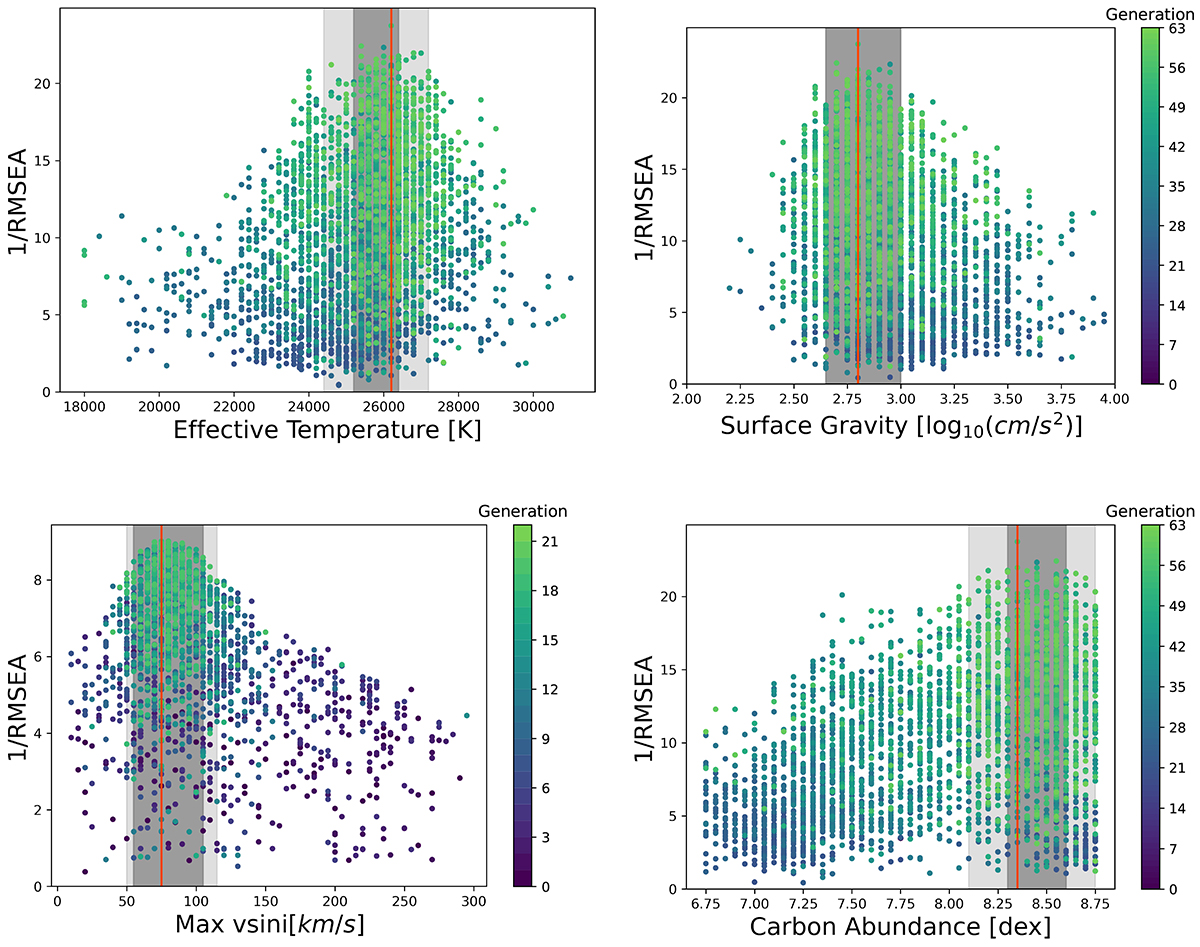
Fig. 3.
Download original image
Distribution of the quality of the fits for stellar parameters of star Sk−68 ° 41. In dark grey the 1-σ interval is shown while the light grey shows the 2-σ interval. The red line shows the best fit value. We only display the C-abundance as the other elements have similar fitting curves. As mentioned in Section 2.3 and the following sections we derive the maximum projected rotational velocity from the optical-only fit which is why there are only 21 generations.
Current usage metrics show cumulative count of Article Views (full-text article views including HTML views, PDF and ePub downloads, according to the available data) and Abstracts Views on Vision4Press platform.
Data correspond to usage on the plateform after 2015. The current usage metrics is available 48-96 hours after online publication and is updated daily on week days.
Initial download of the metrics may take a while.