Open Access
Fig. 11.
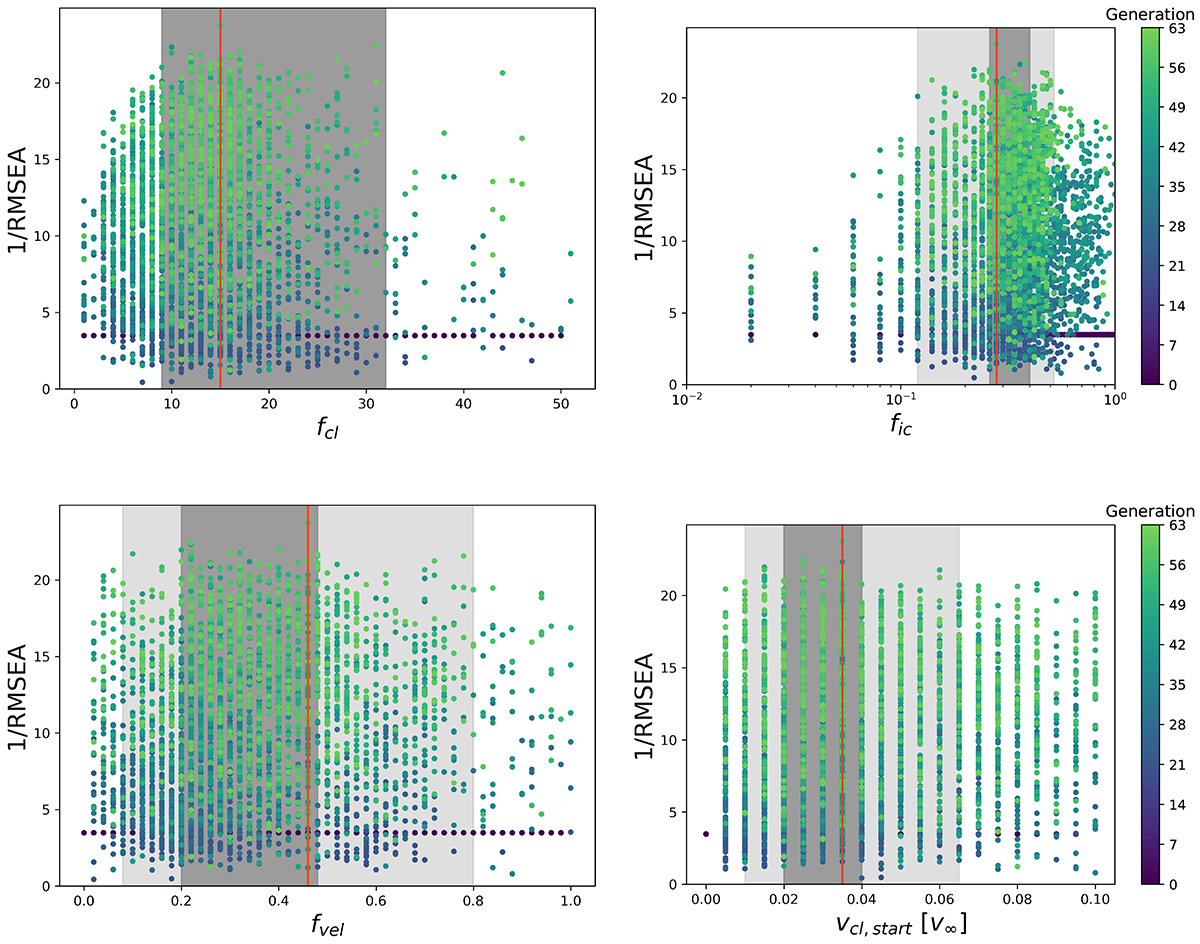
Download original image
Distribution of the quality of the fits for clumping parameters. We show a typical distribution of the models at end of a GA fitting run. The colour indicates the generation of the model and the grey areas indicate the 1σ and 2σ uncertainty intervals.
Current usage metrics show cumulative count of Article Views (full-text article views including HTML views, PDF and ePub downloads, according to the available data) and Abstracts Views on Vision4Press platform.
Data correspond to usage on the plateform after 2015. The current usage metrics is available 48-96 hours after online publication and is updated daily on week days.
Initial download of the metrics may take a while.