Fig. 3
Download original image
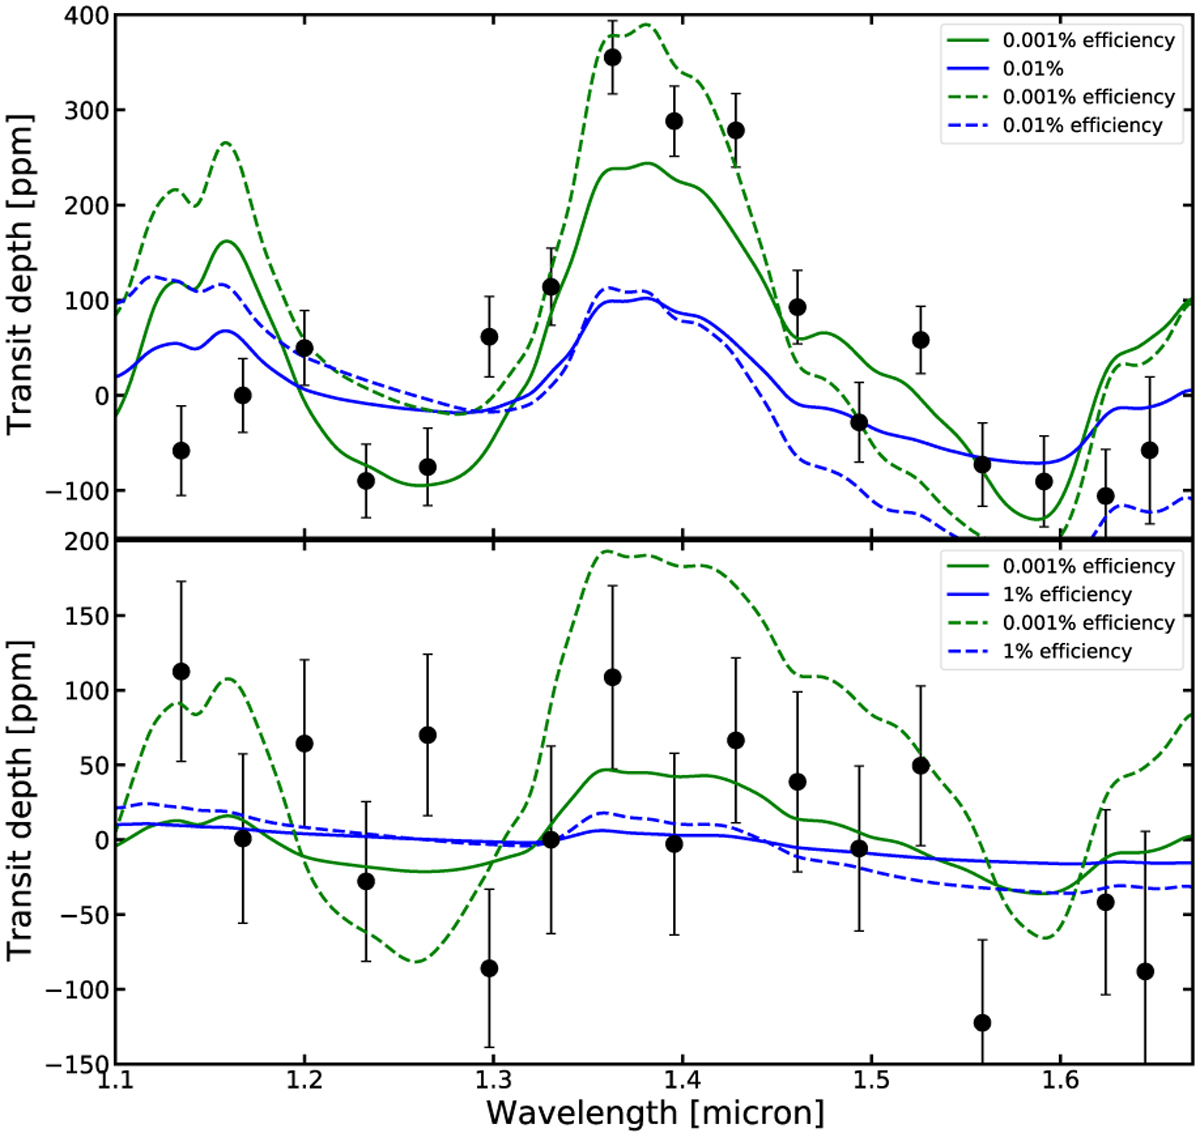
Comparison between observed HST transmission spectrum of V1298 Tau b (upper panel) and V1298 Tau c (lower panel) with haze grid models of different haze formation efficiency and planet mass. Upper panel: Solid lines represent models assuming 23 M⊕. Dashed lines represent models with 8 Mθ, which have been rescaled from the 10 M⊕ haze grid model of planet b. Blue and green represent haze formation efficiencies of 0.01% and 0.001%, respectively. Lower panel: Solid lines represent models assuming 17 M⊕ rescaled from the 20 Mθ haze grid model for planet c. Dashed lines represent models with 10 Mθ. Blue and green represent haze formation efficiencies of 1% and 0.001%, respectively.
Current usage metrics show cumulative count of Article Views (full-text article views including HTML views, PDF and ePub downloads, according to the available data) and Abstracts Views on Vision4Press platform.
Data correspond to usage on the plateform after 2015. The current usage metrics is available 48-96 hours after online publication and is updated daily on week days.
Initial download of the metrics may take a while.