Fig. 2
Download original image
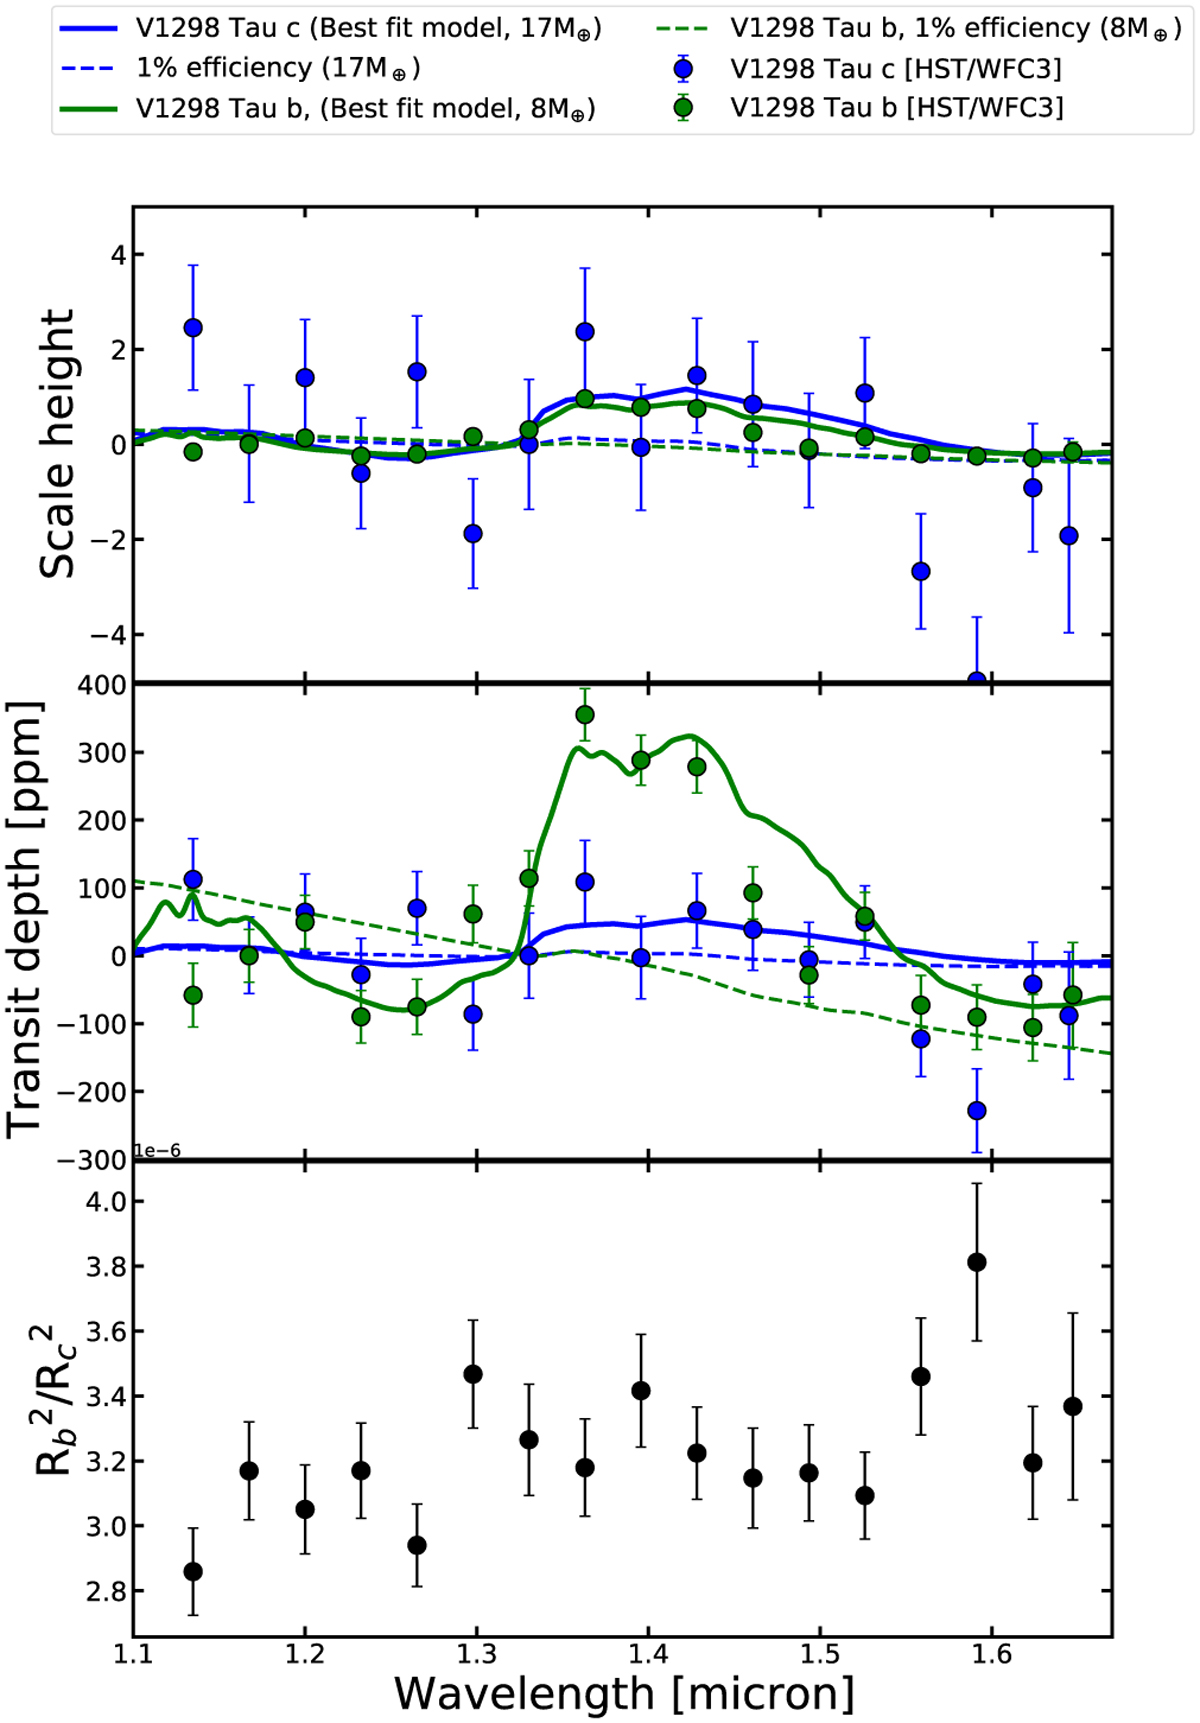
Transmission spectrum of V1298 Tau c (blue points) shown in comparison with its sibling planet V1298 Tau b (green points). The spectra have been derived by subtracting the median of the observed spectrum. The upper panel shows the spectra in terms of atmospheric scale height and the middle panel in terms of transit depth. We assumed Teq=979 K and 17 M⊕ for planet c and 685 K and 8 M⊕ for planet b to calculate the scale height for each planet. We assumed H/He-dominated primordial atmospheres and assumed a mean molecular weight of 2.33. The solid green and blue lines show the best-fit ATMO models from our retrievals for planet b and c with 8 and 17 M⊕, respectively (Sect. 3.2). The dashed lines show hazy atmospheric models for both planets simulated using the formalism presented in Kawashima & Ikoma (2018) (see Sect. 3.3). We show hazy atmospheric models with the same mass as the best-fit models and have been generated by rescaling the hazy atmospheric model grids described in Sect. 3.3. The lower panel shows the relative transmission spectrum (i.e., the ratio between transmission spectra) between V1298 Tau b and V1298 Tau c (see Sect. 3.4).
Current usage metrics show cumulative count of Article Views (full-text article views including HTML views, PDF and ePub downloads, according to the available data) and Abstracts Views on Vision4Press platform.
Data correspond to usage on the plateform after 2015. The current usage metrics is available 48-96 hours after online publication and is updated daily on week days.
Initial download of the metrics may take a while.