Fig. 1
Download original image
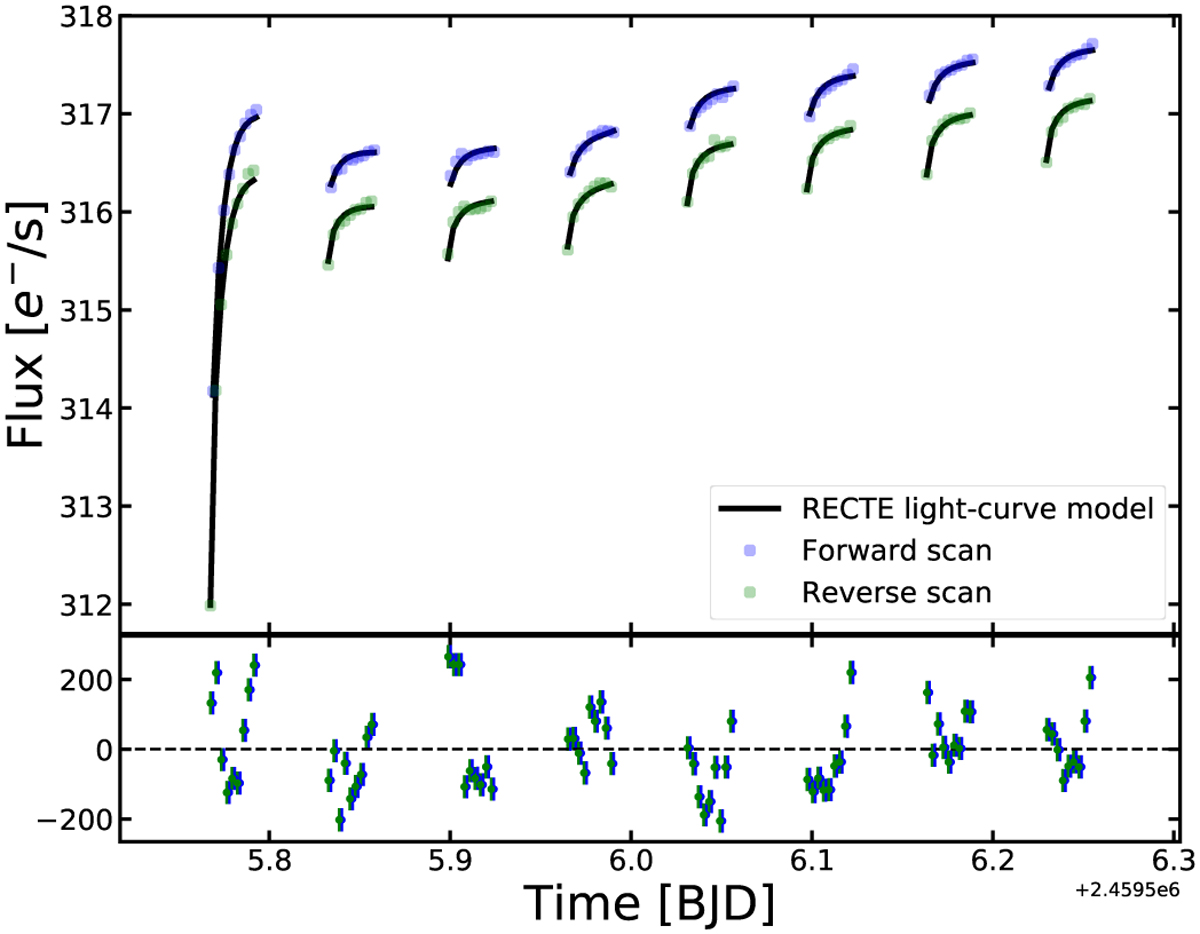
Transit light curve of V1298 Tau c observed using HST/WFC G141. Upper panel: raw white (1.12-1.65µm band) light curve for the transit of V1298 Tau c. Blue and green points show forward and reverse scanned exposures, respectively. The solid black lines show the best-fit transit model. We used a physically motivated charge trapping model, RECTE (Zhou et al. 2017, 2020) to fit the exponential ramps. The baseline was modeled using a quadratic function in time. See Appendix C for further discussion. The transit was modeled using batman (Kreidberg 2015). For details of light curve fitting, see Sect. 2. Lower panel: residuals from the fit to the white light curve observations.
Current usage metrics show cumulative count of Article Views (full-text article views including HTML views, PDF and ePub downloads, according to the available data) and Abstracts Views on Vision4Press platform.
Data correspond to usage on the plateform after 2015. The current usage metrics is available 48-96 hours after online publication and is updated daily on week days.
Initial download of the metrics may take a while.