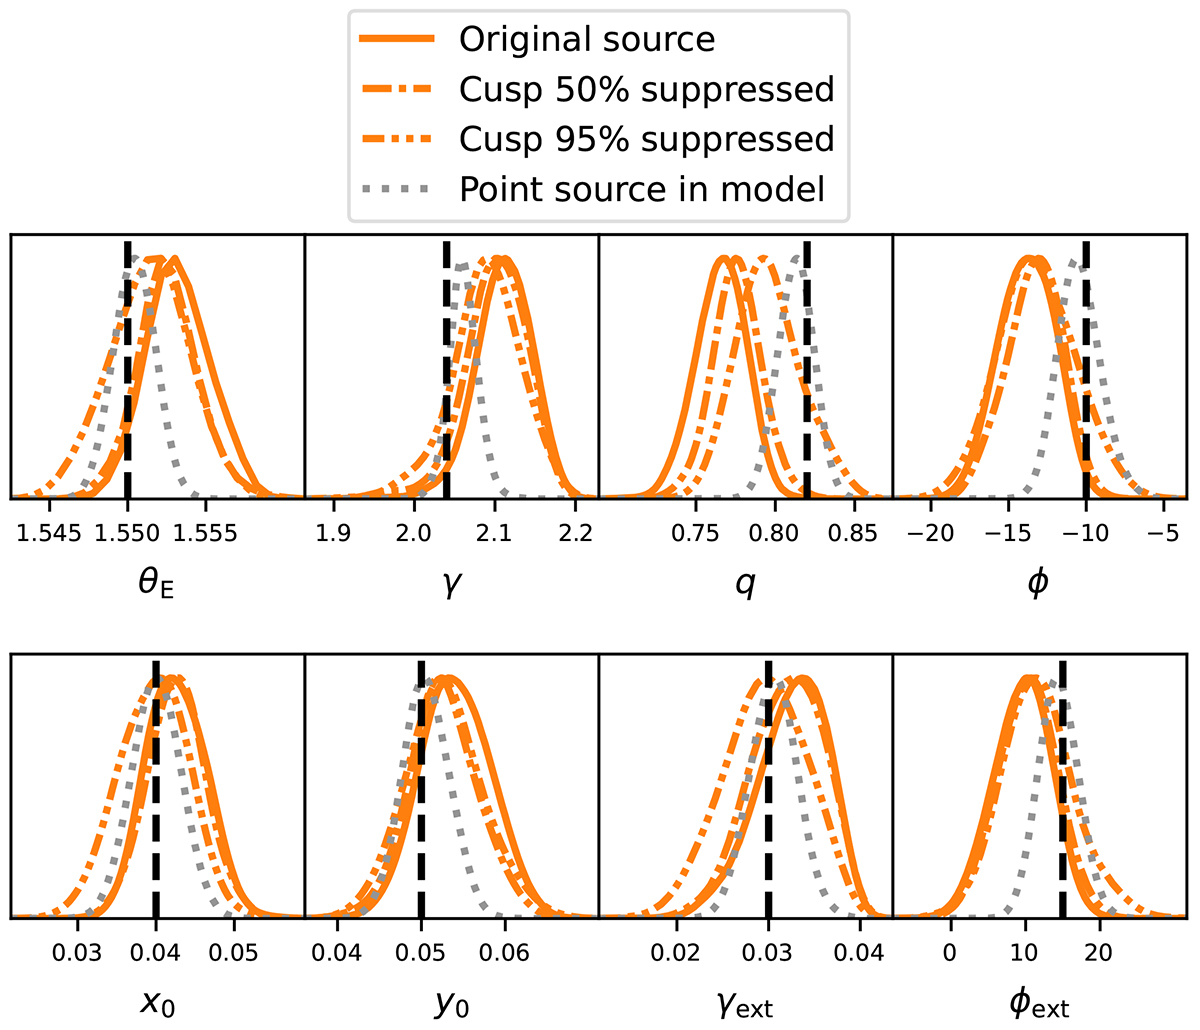
Fig. 9.
Download original image
Posterior distributions of the lens potential parameters for the three models shown in Fig. 8. The fourth model (bottom in the legend) corresponds to a model of the original mock after including a point source component in the source model. When the cuspy central region of the source is suppressed from the data, or if a point source feature is added in the source model, the resulting distributions are less biased and shift closer to the true values.
Current usage metrics show cumulative count of Article Views (full-text article views including HTML views, PDF and ePub downloads, according to the available data) and Abstracts Views on Vision4Press platform.
Data correspond to usage on the plateform after 2015. The current usage metrics is available 48-96 hours after online publication and is updated daily on week days.
Initial download of the metrics may take a while.