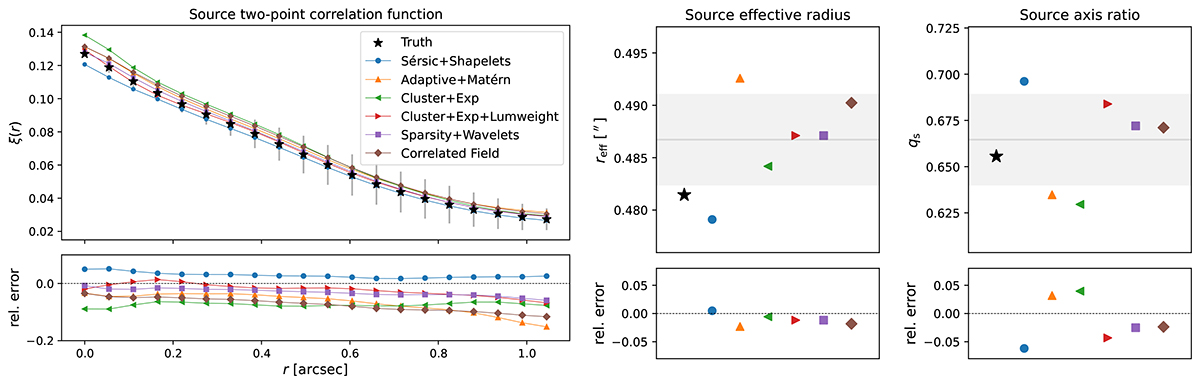
Fig. 4.
Download original image
Recovery of source properties among the six blind lens models shown in Fig. 2 (the legend in the right panel is also valid of other panels). Left panels: Azimuthally averaged two-point correlation functions, ξ(r), of the recovered sources, compared to the truth, which measures the correlation between pixels separated by a given distance, r (in arcsec). Middle panels: Source effective radius reff, computed within a circular aperture. Right panels: Source axis ratio, qs, estimated from the central moments of the source model. The bottom panel in each column indicates, the relative error with respect to to the true quantity, computed as ![]() . For reff and qs, the shaded gray region indicates the mean and 1σ scatter among the models.
. For reff and qs, the shaded gray region indicates the mean and 1σ scatter among the models.
Current usage metrics show cumulative count of Article Views (full-text article views including HTML views, PDF and ePub downloads, according to the available data) and Abstracts Views on Vision4Press platform.
Data correspond to usage on the plateform after 2015. The current usage metrics is available 48-96 hours after online publication and is updated daily on week days.
Initial download of the metrics may take a while.