Fig. 3.
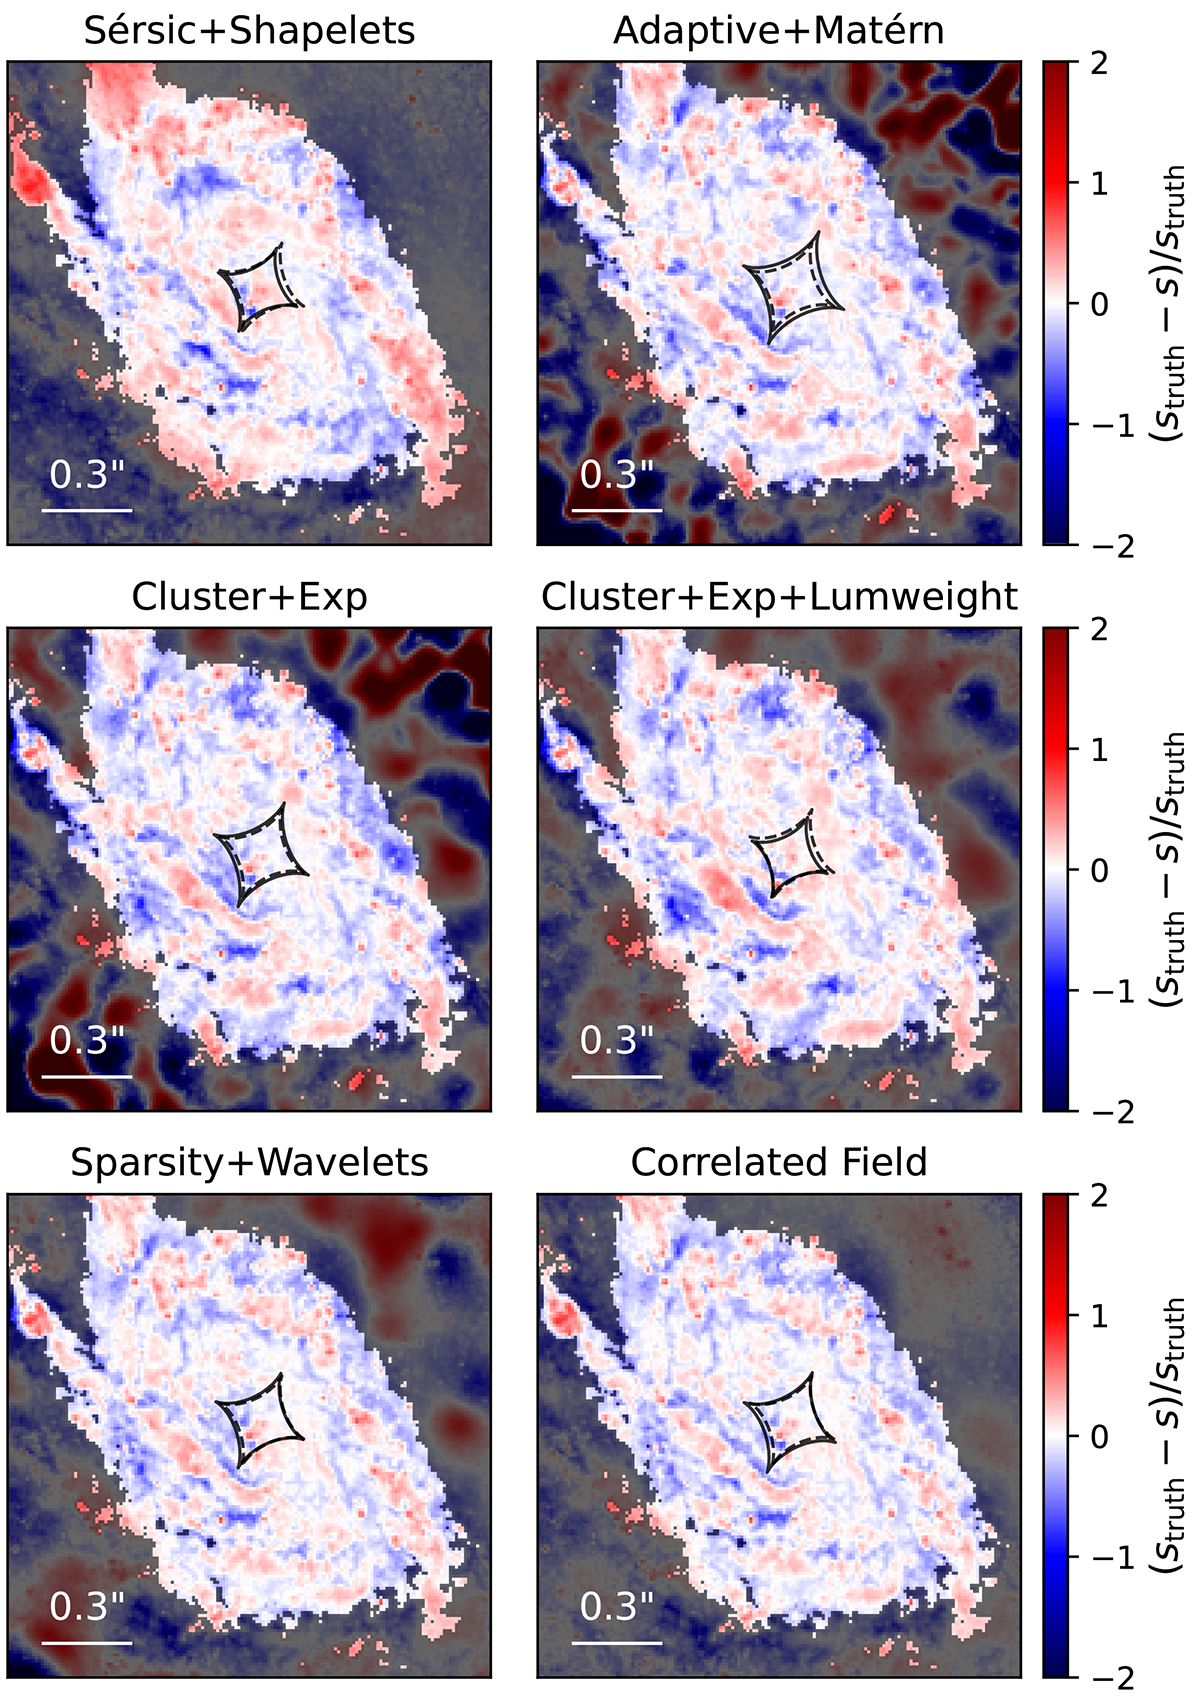
Download original image
Source plane residuals between the true source and the models shown in the fourth row of Fig. 2. Away from the center, the true source intensity is close to zero and models are less accurate, thus these areas are darkened for better visualization. Caustics from the best-fit (solid lines) and true (dashed lines) lens models are shown as well. Within the caustics, all models overall recover the source structure.
Current usage metrics show cumulative count of Article Views (full-text article views including HTML views, PDF and ePub downloads, according to the available data) and Abstracts Views on Vision4Press platform.
Data correspond to usage on the plateform after 2015. The current usage metrics is available 48-96 hours after online publication and is updated daily on week days.
Initial download of the metrics may take a while.