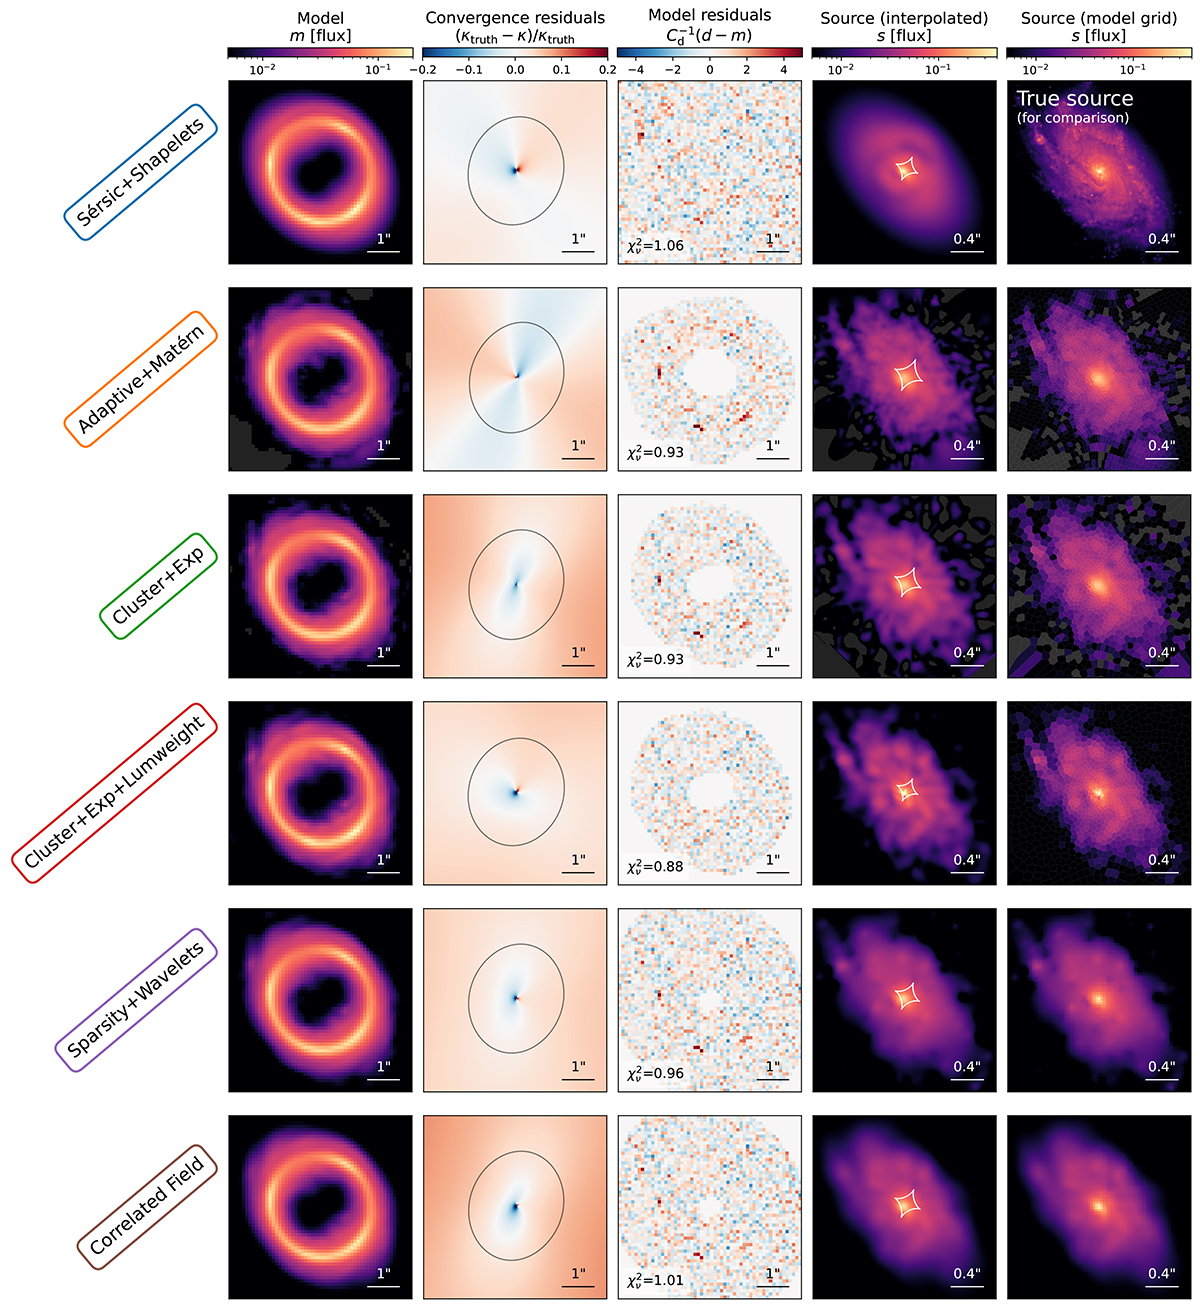
Fig. 2.
Download original image
Comparison between all blindly submitted models of the data shown in Fig. 1. The leftmost area gives the labels associated with each modeling method (see also Table 1), as well as their associated color used for the subsequent figures of this paper. First column: Image model. Second column: Relative difference between the true and modeled convergence maps, with the predicted tangential critical line shown as a black line. Third column: Normalized model residuals, with associated reduced chi-squared χν2 indicated in the bottom left. The white areas are outside the likelihood mask chosen by the modelers and are thus excluded during modeling. Fourth column: reconstructed source models, all interpolated onto the same (regular) high-resolution grid to ease visual comparison. The predicted tangential caustic is also indicated as a white line. Last column, first panel: True source as in Fig. 1, to ease comparison with the models. Last column, remaining panels: Reconstructed source models on their original discretization grid, which can be regular or irregular, when applicable (the Sérsic+Shapelets model is not defined on a grid). All panels have been generated using COOLEST routines from the standardized storage of each model.
Current usage metrics show cumulative count of Article Views (full-text article views including HTML views, PDF and ePub downloads, according to the available data) and Abstracts Views on Vision4Press platform.
Data correspond to usage on the plateform after 2015. The current usage metrics is available 48-96 hours after online publication and is updated daily on week days.
Initial download of the metrics may take a while.