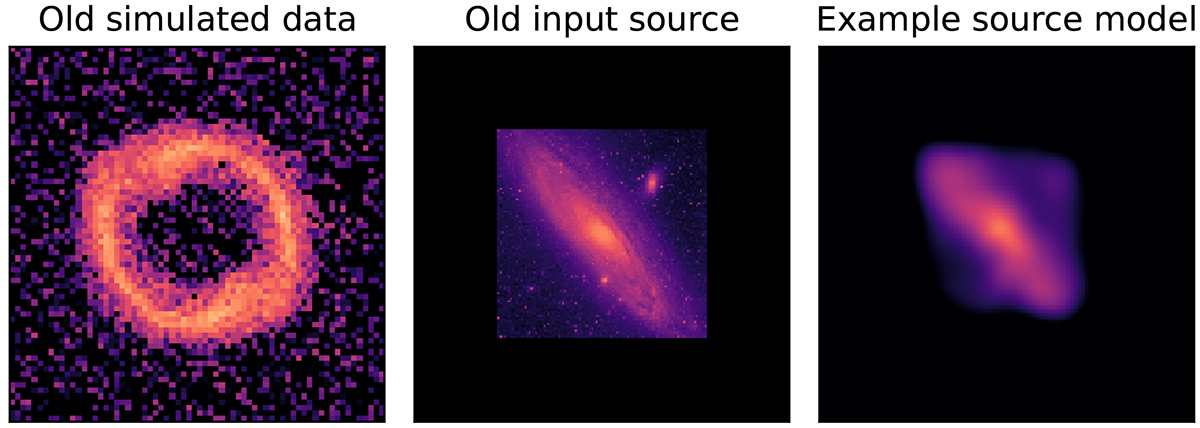
Fig. A.1.
Download original image
Old simulated lensing data based on another source galaxy. For that mock the source image background was insufficiently subtracted, which left a faint imprints in the data after being lensed. While unnoticeable to the eye in the data (left panel), the square boundaries of the source are clearly noticeable in the input source (middle panel) and even on the reconstructed source (right panel, using a correlated field model as an example). These artificial boundaries led to biases in lens potential parameters and source size. Note that a logarithmic scale is used in all panels.
Current usage metrics show cumulative count of Article Views (full-text article views including HTML views, PDF and ePub downloads, according to the available data) and Abstracts Views on Vision4Press platform.
Data correspond to usage on the plateform after 2015. The current usage metrics is available 48-96 hours after online publication and is updated daily on week days.
Initial download of the metrics may take a while.