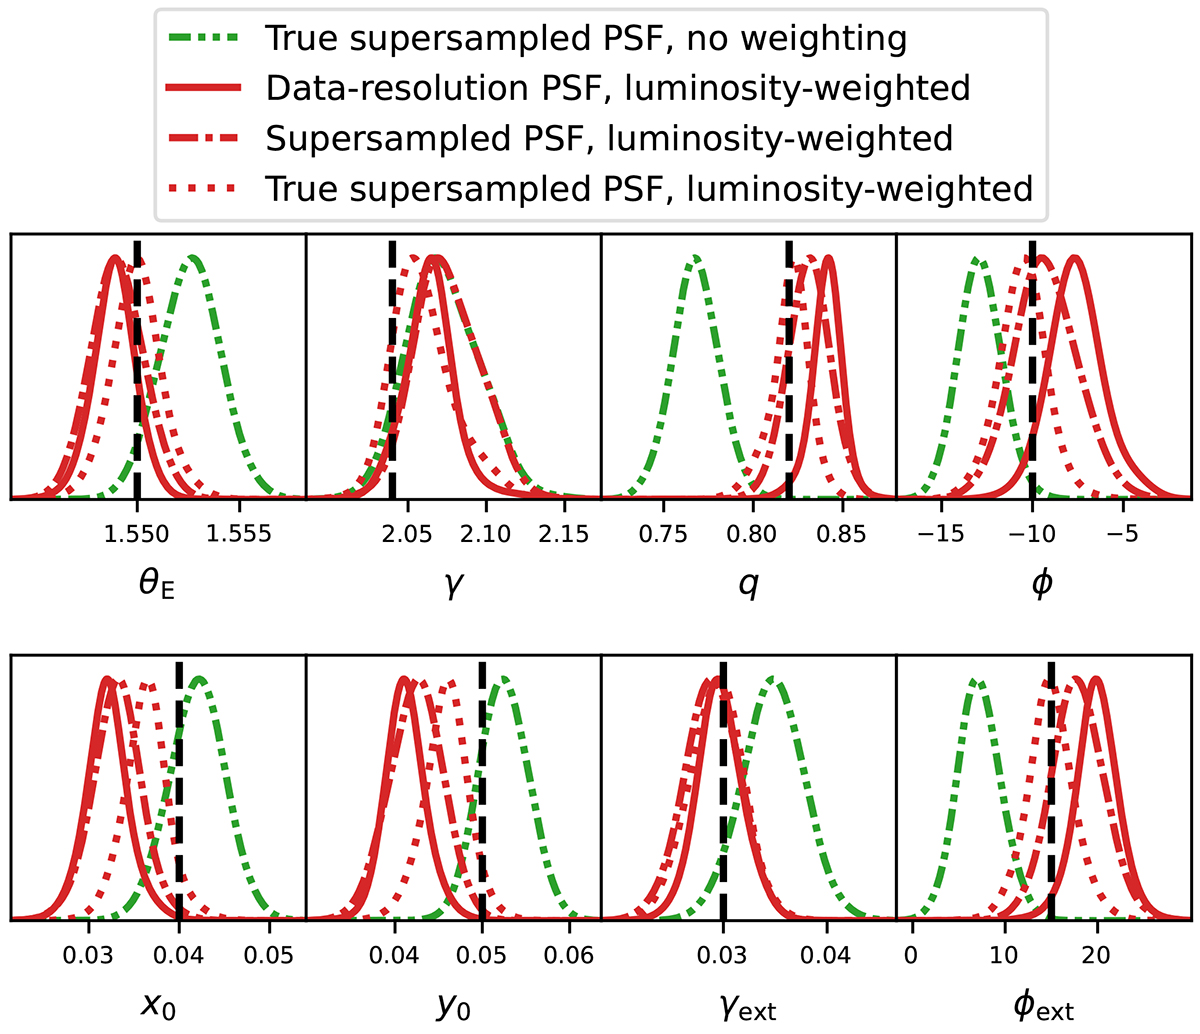
Fig. 10.
Download original image
Posterior distributions of lens potential parameters obtained with models exploring the role of the PSF. The dash-dotted green line distributions correspond to the Cluster+Exp model (i.e., similar to the green model in Fig. 6) using the true supersampled PSF used for simulating the data (top left panel of Fig. 11). The solid red line distributions are showing, for reference, the blindly submitted model Cluster+Exp+Lumweight (i.e., the same model as in Fig. 6). The dash-dotted and dotted red distributions, also obtained with the Cluster+Exp+Lumweight model, use a supersampled (interpolated) version of the data-resolution PSF (bottom left panel in Fig. 11) or the true supersampled PSF, respectively. The main result of this comparison is that biases in lens model parameters are most reduced only with a combination of a more accurate PSF and a model that can capture magnified cuspy features in the source.
Current usage metrics show cumulative count of Article Views (full-text article views including HTML views, PDF and ePub downloads, according to the available data) and Abstracts Views on Vision4Press platform.
Data correspond to usage on the plateform after 2015. The current usage metrics is available 48-96 hours after online publication and is updated daily on week days.
Initial download of the metrics may take a while.