Fig. 1.
Download original image
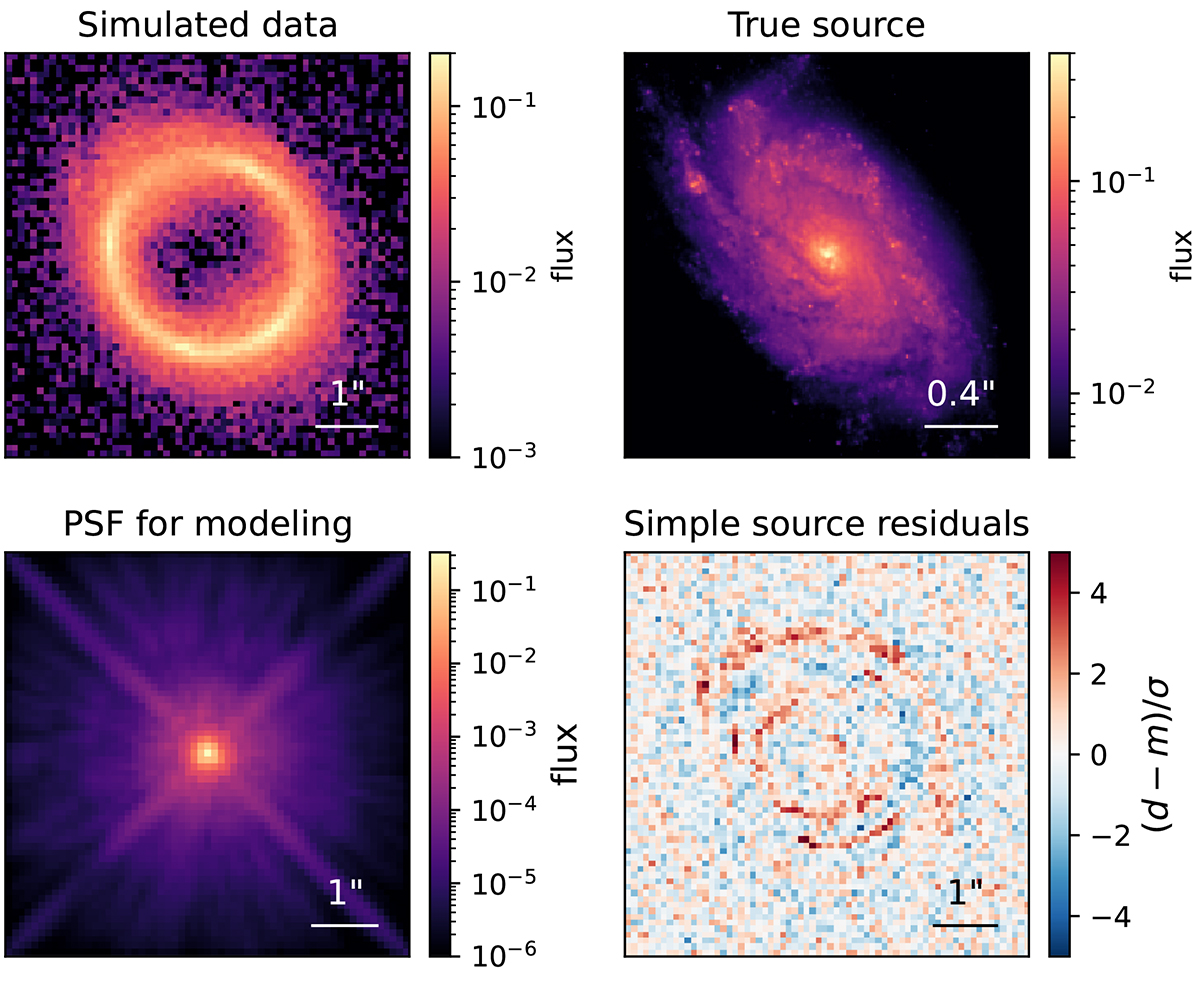
Simulated HST imaging data used for the blind lens modeling experiment (see Sect. 4 for details). The top left panel shows a zoom-in cutout of the data. The top right panels shows the true (unlensed) source surface brightness. The bottom left panel shows the true PSF kernel downscaled to the data resolution (and given to the modelers). The bottom right panel shows normalized residuals in image plane obtained with a too simplistic source model (a single Sérsic profile).
Current usage metrics show cumulative count of Article Views (full-text article views including HTML views, PDF and ePub downloads, according to the available data) and Abstracts Views on Vision4Press platform.
Data correspond to usage on the plateform after 2015. The current usage metrics is available 48-96 hours after online publication and is updated daily on week days.
Initial download of the metrics may take a while.