Open Access
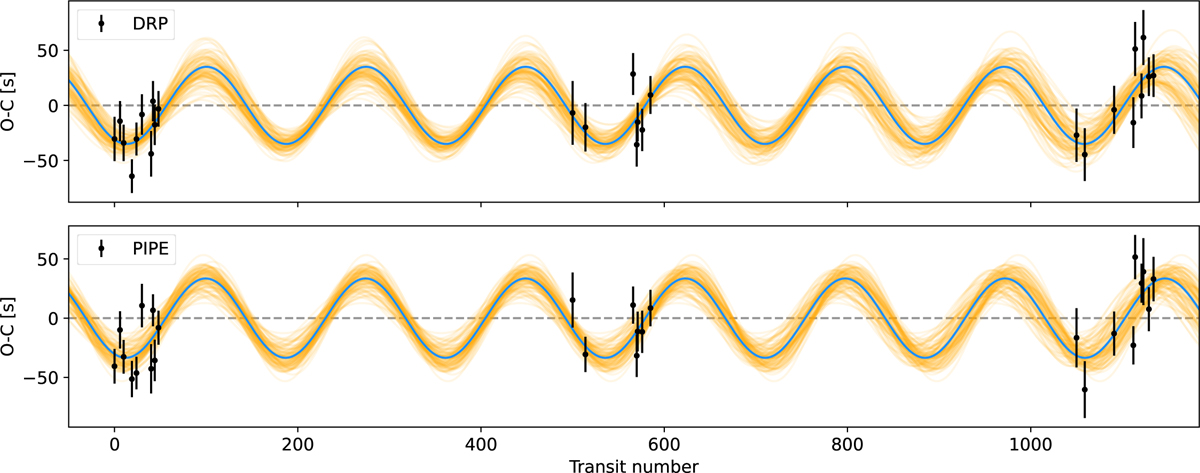
Fig. 4
Download original image
Timing variation plots of the DRP (top) and PIPE (bottom) reductions, showing the lowest BIC models for the two datasets. The blue lines show the median solutions, with the thin orange lines showing random samples drawn from the posterior distribution. The dashed grey lines indicate the best linear models.
Current usage metrics show cumulative count of Article Views (full-text article views including HTML views, PDF and ePub downloads, according to the available data) and Abstracts Views on Vision4Press platform.
Data correspond to usage on the plateform after 2015. The current usage metrics is available 48-96 hours after online publication and is updated daily on week days.
Initial download of the metrics may take a while.