Fig. B.1
Download original image
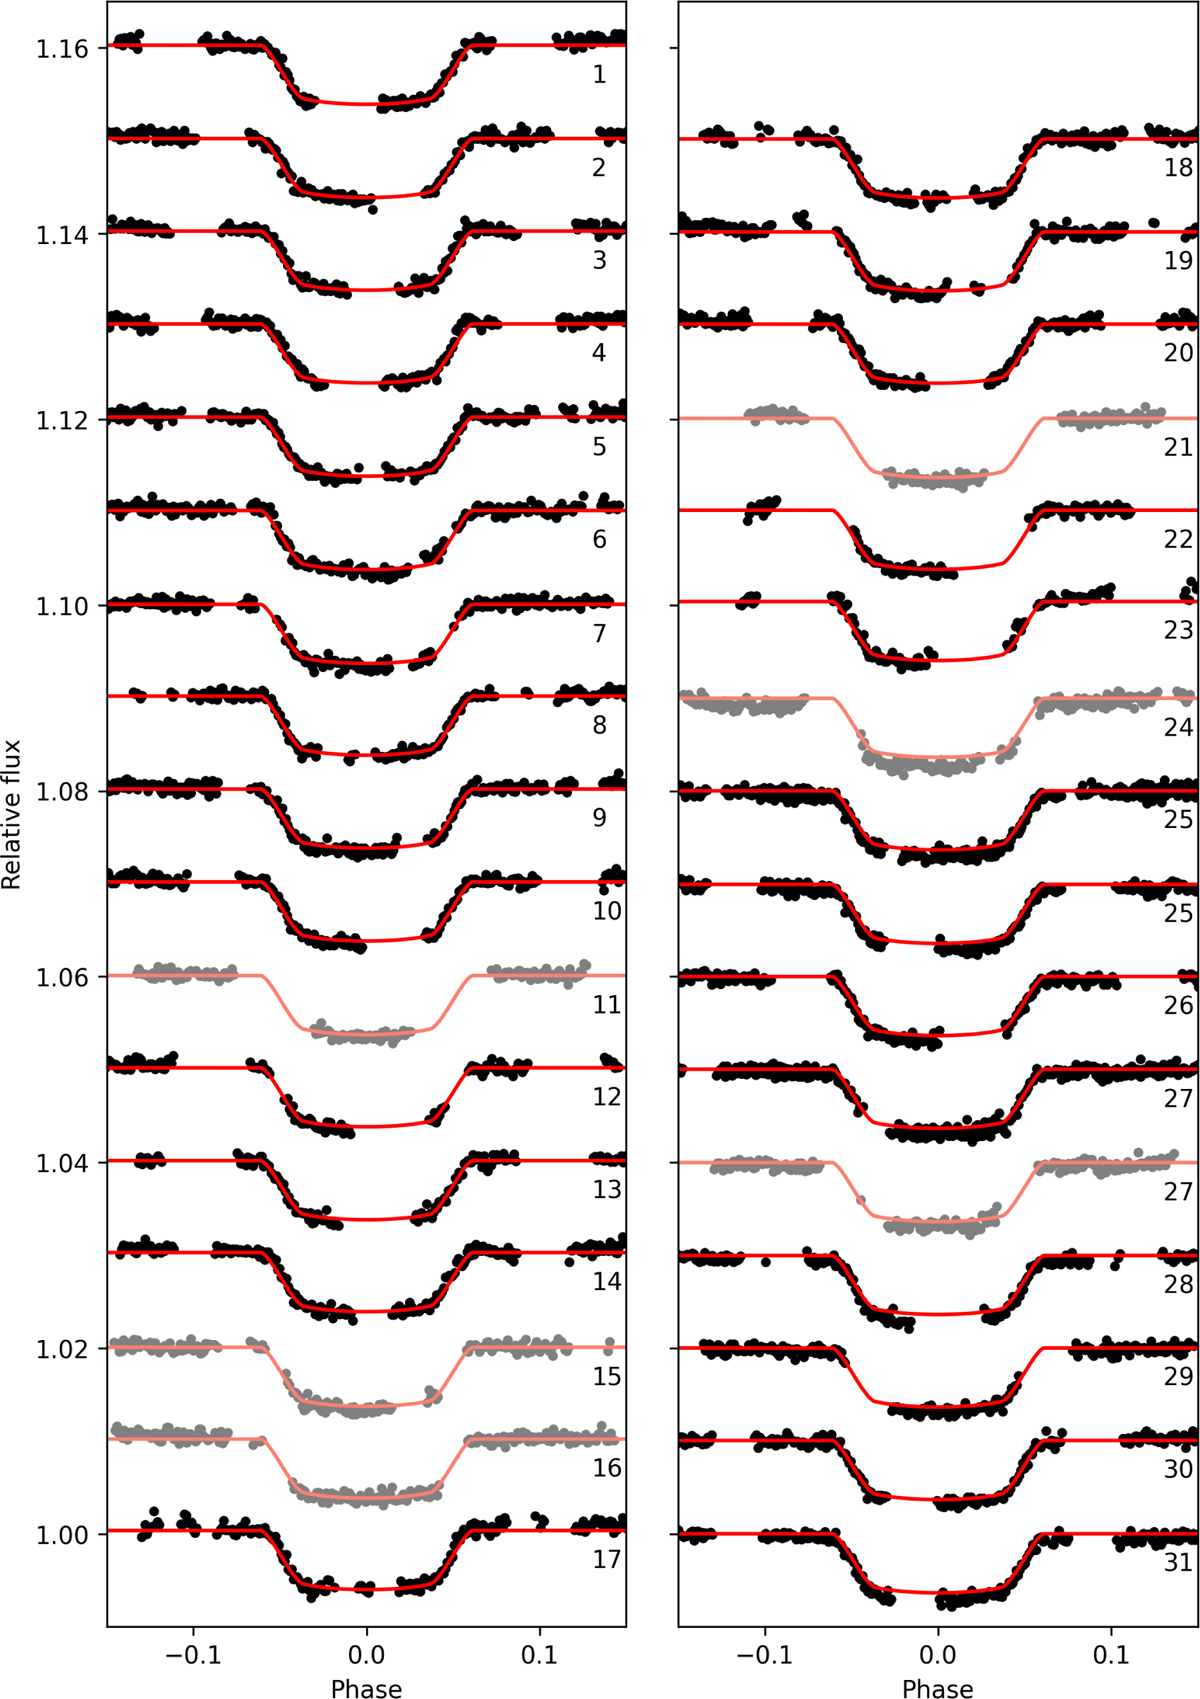
All individual transits from the PIPE data (black) that were fitted using TLCM with the respective transit models (red). The numbers below each transit light curve indicate the number of the corresponding visit, see Table A.1. Duplications in visit number refer to the first and second transit in a phase-curve observation. If the resulting transit timings were not used in the TTV analysis, they are greyed out.
Current usage metrics show cumulative count of Article Views (full-text article views including HTML views, PDF and ePub downloads, according to the available data) and Abstracts Views on Vision4Press platform.
Data correspond to usage on the plateform after 2015. The current usage metrics is available 48-96 hours after online publication and is updated daily on week days.
Initial download of the metrics may take a while.