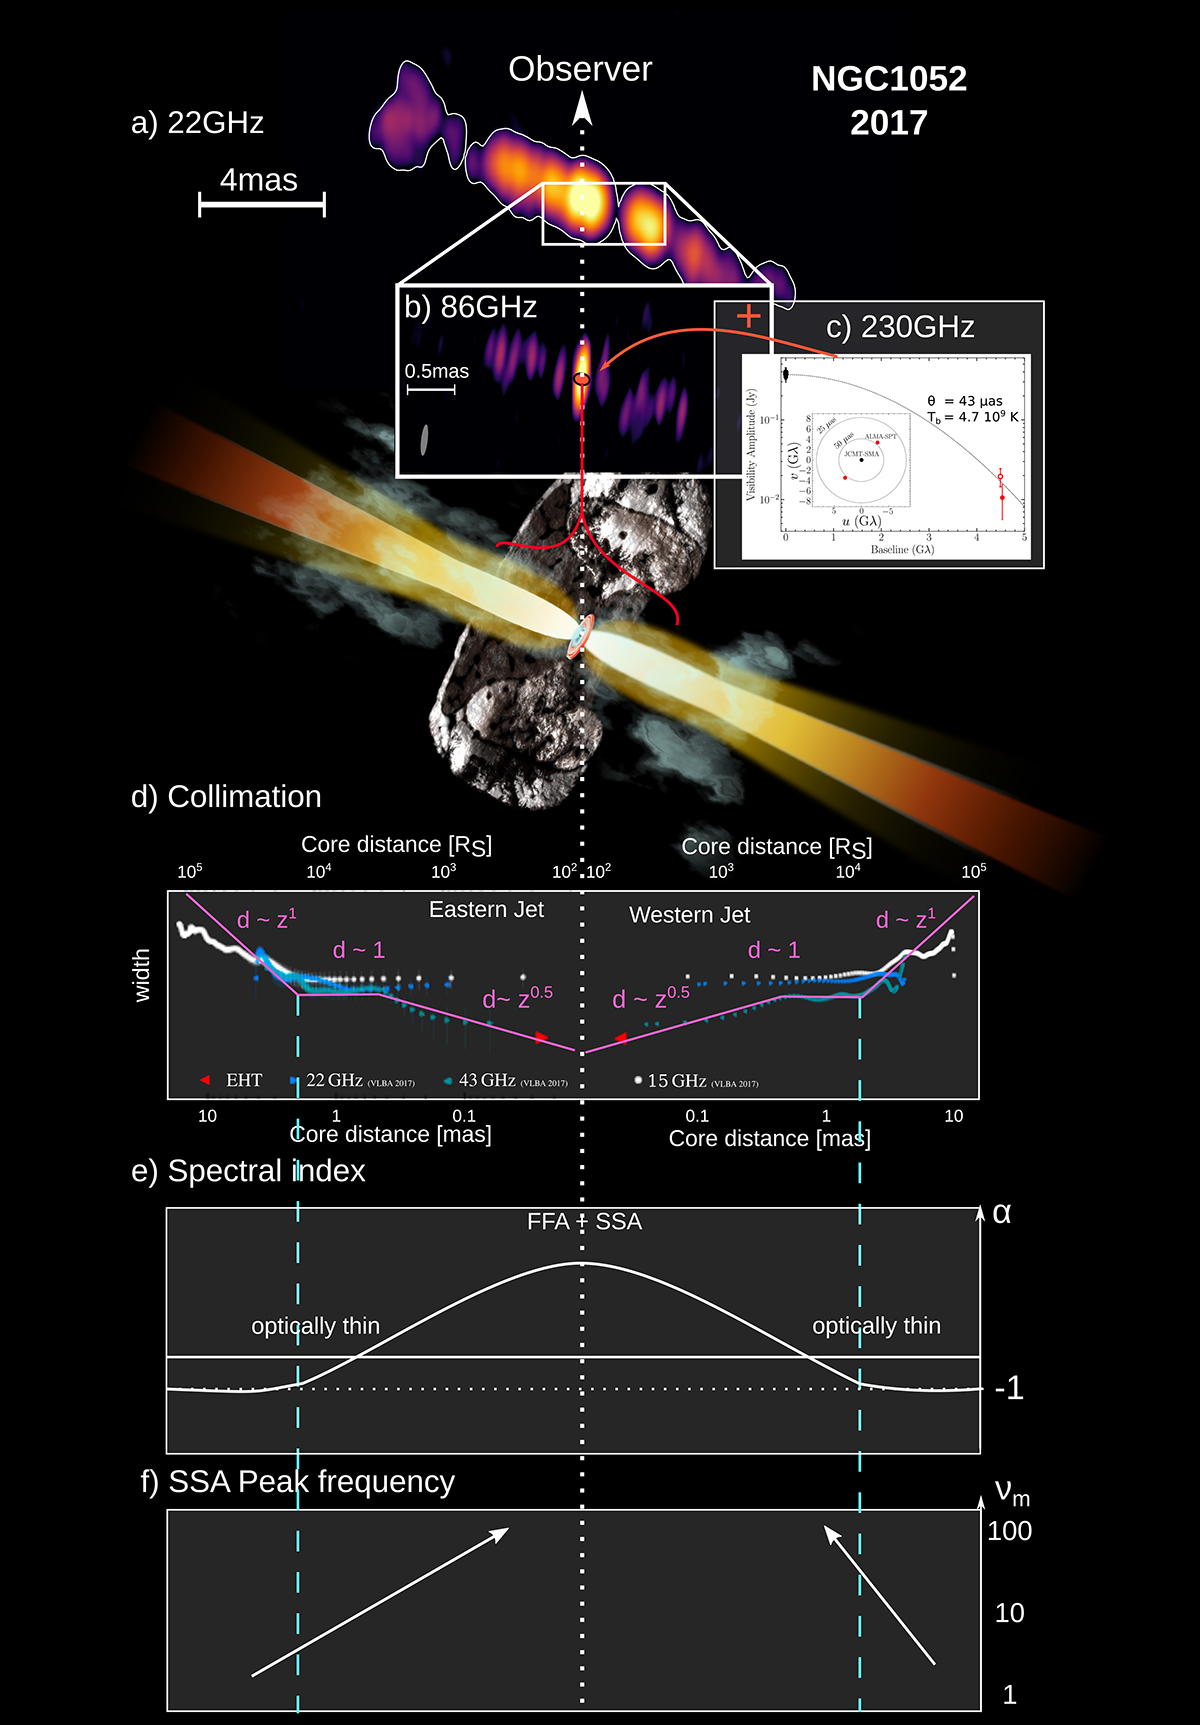
Fig. 6.
Download original image
Summary sketch of the inner region in NGC 1052. (a) 2017 22GHz VLBA map with (b) 2017 86 GHz GMVA map zoom in below and (c) EHT visibility plot to the right. Background: Sketch of AGN model, the observer is to the top, the western (right) jet is receding. (d) Jet width at stacked VLBA 22 and 43 GHz, and at 230 GHz and (magenta) power-laws for parabolic, cylindrical, and conical profiles. (e) Sketch visualizing the optically thin and thick regions in the jets. (f) Peak frequency of the SSA-fit moves towards higher frequencies closer to the central engine.
Current usage metrics show cumulative count of Article Views (full-text article views including HTML views, PDF and ePub downloads, according to the available data) and Abstracts Views on Vision4Press platform.
Data correspond to usage on the plateform after 2015. The current usage metrics is available 48-96 hours after online publication and is updated daily on week days.
Initial download of the metrics may take a while.