Fig. 5.
Download original image
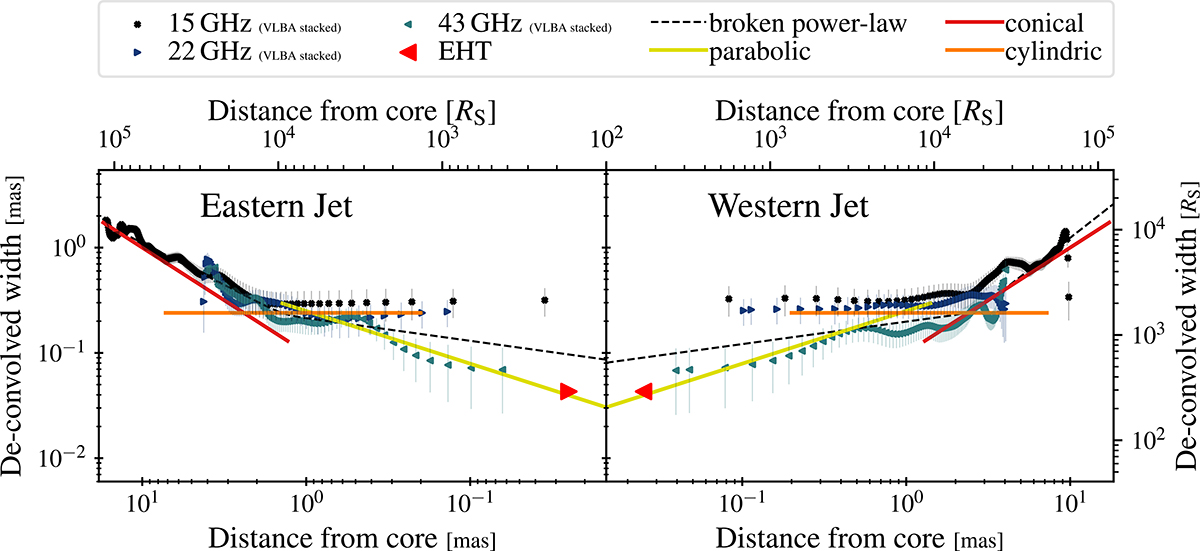
Jet width of stacked 15, 22, and 43 GHz VLBA images reported in Baczko et al. (2022) and 230 GHz (EHT 2017). The black, dotted line denotes a fitted broken power-law to the VLBA images with the power-law indices for the Eastern jet of ku = 0.22 ± 0.06 and kd = 0.80 ± 0.01 for upstream and downstream of the break point, respectively, and for the Western jet of ku = 0.26 ± 0.06 and kd = 1.22 ± 0.05. Red triangle shows the size of the EHT component at an upper limit on the distance to the center. Orange, yellow, and red lines correspond to (not fitted) power laws with power-law indices of k = 0, k = 0.5, and k = 1, as suggested by the high-frequency data.
Current usage metrics show cumulative count of Article Views (full-text article views including HTML views, PDF and ePub downloads, according to the available data) and Abstracts Views on Vision4Press platform.
Data correspond to usage on the plateform after 2015. The current usage metrics is available 48-96 hours after online publication and is updated daily on week days.
Initial download of the metrics may take a while.