Fig. 9.
Download original image
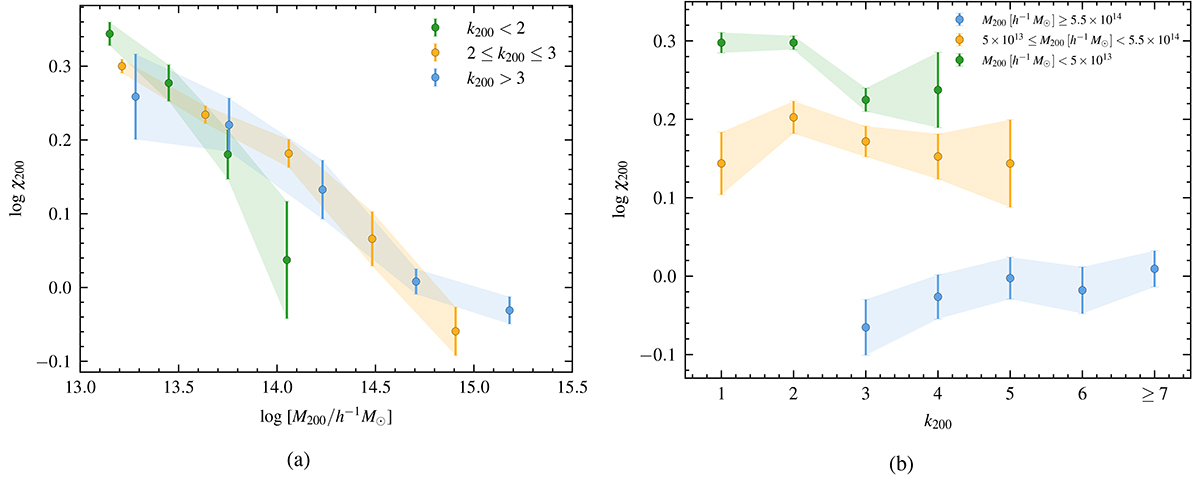
Dynamical state dependence on connectivity and cluster total mass at redshift z = 0. Panel (a): Degree of relaxation, χ200, as a function of the total mass, M200. Green, yellow, and light blue dots indicate, respectively, weakly connected (k200 < 2), average-connected (k200 ∈ {2, 3}), and highly connected (k200 > 3) clusters. Panel (b): Degree of relaxation, χ200, as a function of the connectivity, k200. Green, yellow, and light blue dots indicate, respectively, low-mass (M200 < 5 × 10¹³ h−1 M⊙), medium (5 × 10¹³ ≤ M200 h−1 M⊙ < 5.5 × 10¹⁴), and massive (M200 ≥ 5.5 × 10¹⁴ h−1 M⊙) clusters. The shaded areas and the error bars indicate the error of the mean, computed with the bootstrap method.
Current usage metrics show cumulative count of Article Views (full-text article views including HTML views, PDF and ePub downloads, according to the available data) and Abstracts Views on Vision4Press platform.
Data correspond to usage on the plateform after 2015. The current usage metrics is available 48-96 hours after online publication and is updated daily on week days.
Initial download of the metrics may take a while.