Fig. 4.
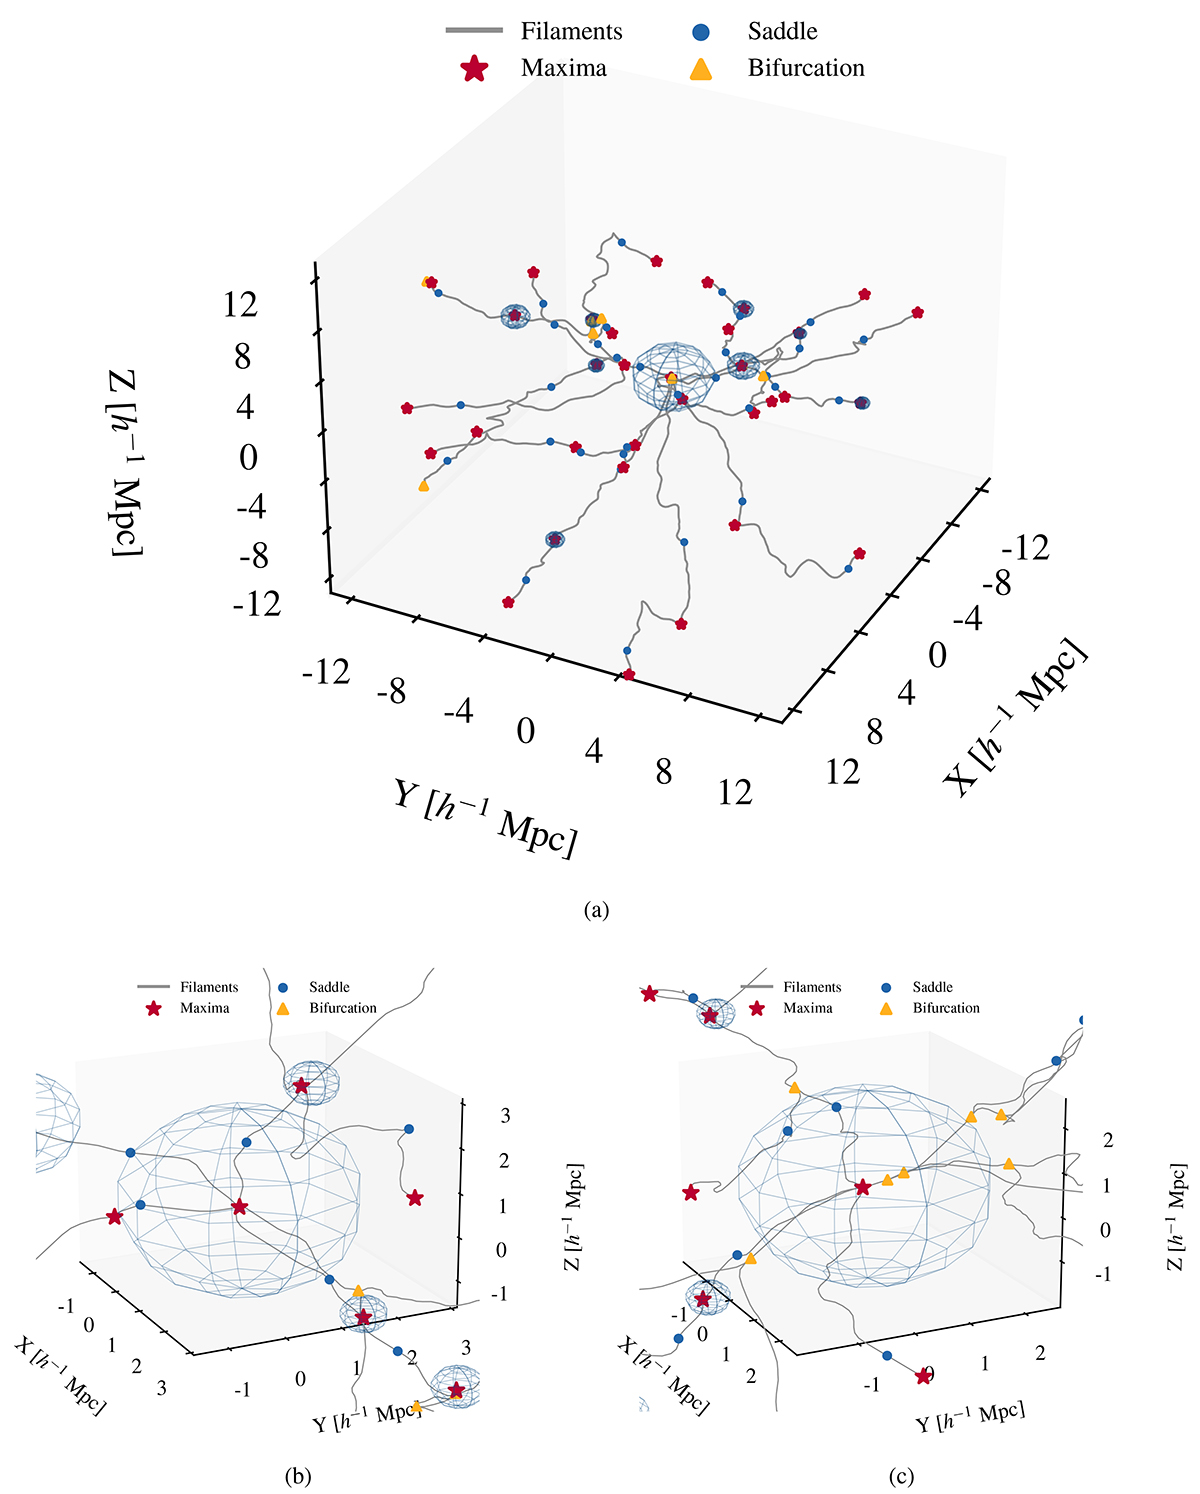
Download original image
Examples of DisPerSE simulated networks. Panel (a): Filaments in region 1 at z = 0. The full filament network is shown in grey. The nodes are shown as red stars, the saddle points as blue dots, and the bifurcation points as yellow triangles. The light blue spheres are the R200 of matched clusters. Panel (b): Zoomed-in view of the central cluster of region 6. Panel (c): Example of two bifurcation points inside the R200 sphere of the central cluster of region 2.
Current usage metrics show cumulative count of Article Views (full-text article views including HTML views, PDF and ePub downloads, according to the available data) and Abstracts Views on Vision4Press platform.
Data correspond to usage on the plateform after 2015. The current usage metrics is available 48-96 hours after online publication and is updated daily on week days.
Initial download of the metrics may take a while.