Fig. 3.
Download original image
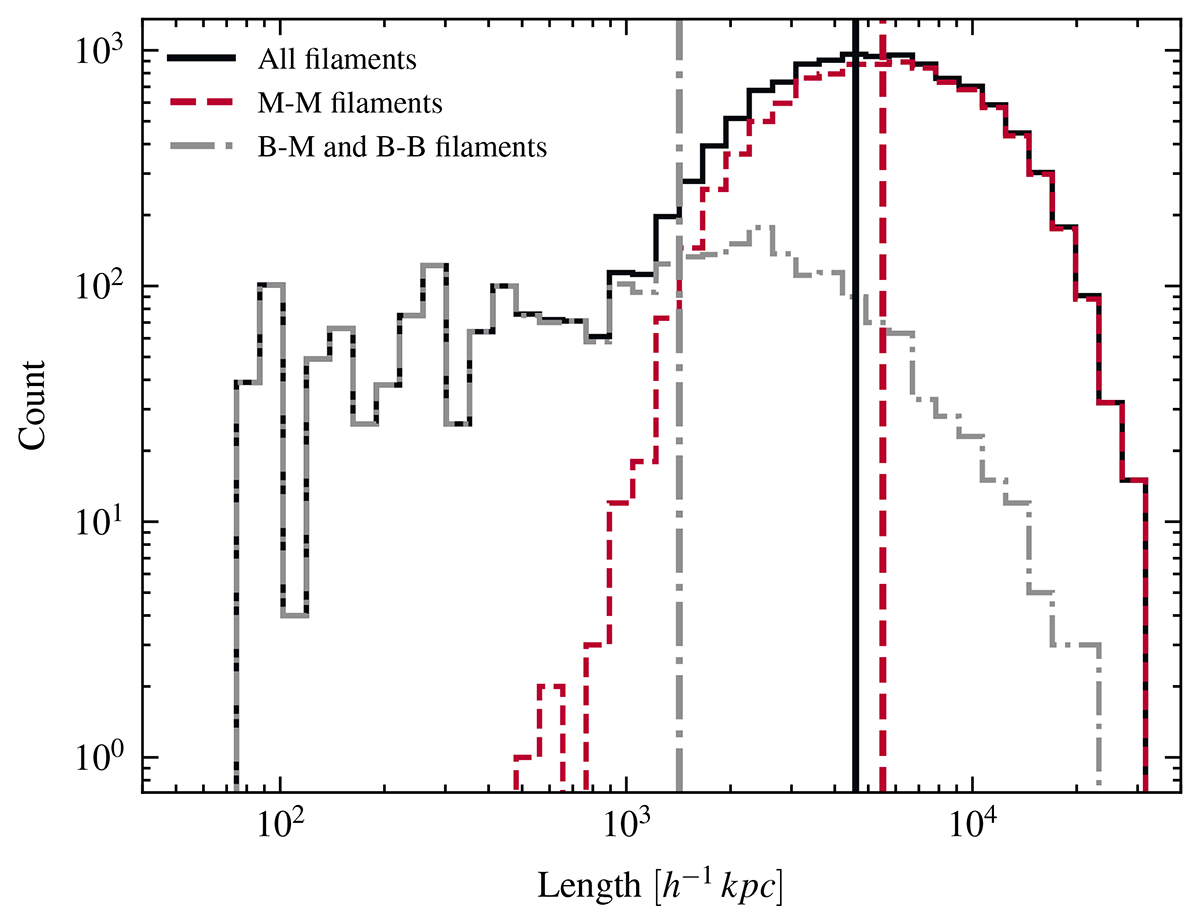
Filaments length distribution. With the solid black line we plot the distribution of length for the whole sample of filaments, with the dashed red line the length distribution of the filaments with two maxima at the extremes, and with the dash-dotted grey line the length of bifurcation-maximum and bifurcation-bifurcation filaments. The vertical lines are the median values of each distribution.
Current usage metrics show cumulative count of Article Views (full-text article views including HTML views, PDF and ePub downloads, according to the available data) and Abstracts Views on Vision4Press platform.
Data correspond to usage on the plateform after 2015. The current usage metrics is available 48-96 hours after online publication and is updated daily on week days.
Initial download of the metrics may take a while.