Fig. B.1.
Download original image
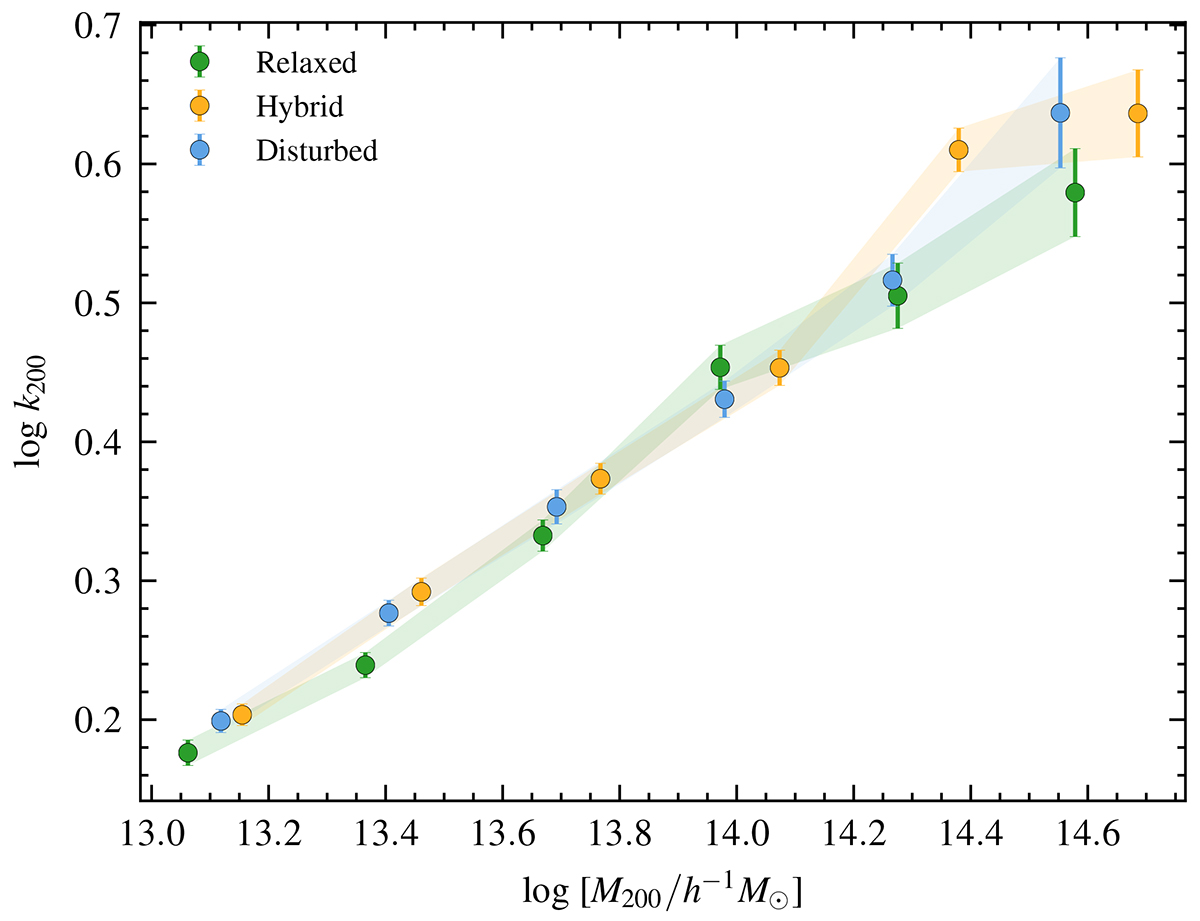
Connectivity and mass relation for three dynamical state sub-samples at redshift z = 1. In green are shown the connectivity mean values, k200, for the dynamically relaxed clusters, in yellow the values for hybrid clusters, and in light blue the ones for dynamically disturbed clusters. The error bars represent the errors of the mean, computed with the bootstrap method.
Current usage metrics show cumulative count of Article Views (full-text article views including HTML views, PDF and ePub downloads, according to the available data) and Abstracts Views on Vision4Press platform.
Data correspond to usage on the plateform after 2015. The current usage metrics is available 48-96 hours after online publication and is updated daily on week days.
Initial download of the metrics may take a while.