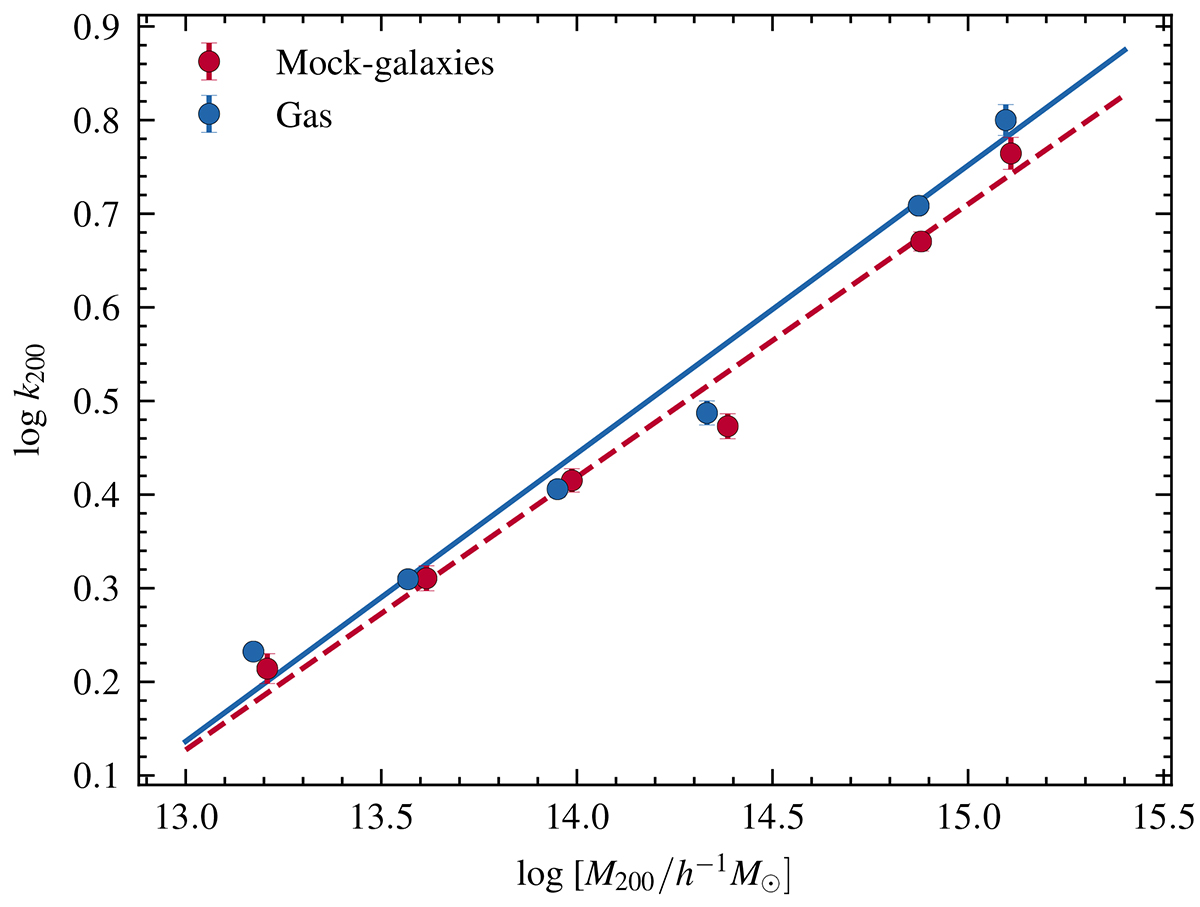
Fig. 11.
Download original image
Mean connectivity of THE THREE HUNDRED groups and clusters at z = 0, estimated from gas and mock-galaxy filaments. The mean values of connectivity, k200, from gas filaments are plotted in blue, and the values of k200 from mock-galaxy filaments are plotted in red. The solid and dashed lines represent the linear fitting for the gas and the mock galaxies, respectively. The error bars are the errors on the mean values, computed with the bootstrap method.
Current usage metrics show cumulative count of Article Views (full-text article views including HTML views, PDF and ePub downloads, according to the available data) and Abstracts Views on Vision4Press platform.
Data correspond to usage on the plateform after 2015. The current usage metrics is available 48-96 hours after online publication and is updated daily on week days.
Initial download of the metrics may take a while.