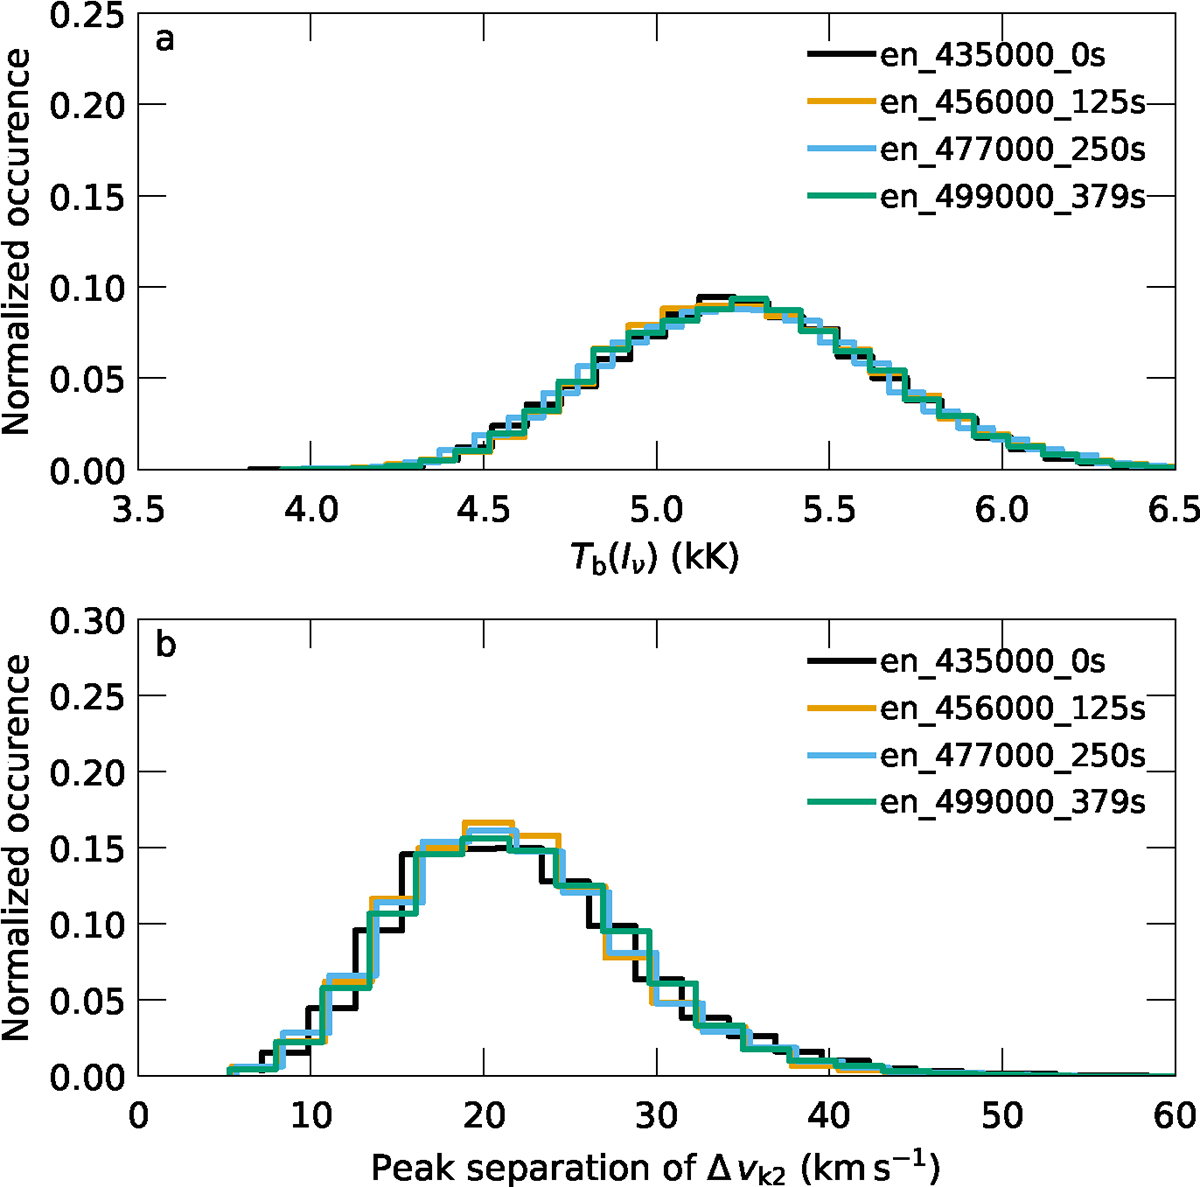
Fig. 9.
Download original image
Distribution of k2 peak intensities in units of brightness temperature (panel a) and peak separation (panel b) for four snapshots in the MURaM-ChE simulation, which are separated by ≈2 min of simulation time. The presented data correspond to every second column in the x and y directions in the snapshots. The spectra were degraded before the peak-finding algorithm was applied. For comparison with Fig. 5, we chose the same limits for the axes.
Current usage metrics show cumulative count of Article Views (full-text article views including HTML views, PDF and ePub downloads, according to the available data) and Abstracts Views on Vision4Press platform.
Data correspond to usage on the plateform after 2015. The current usage metrics is available 48-96 hours after online publication and is updated daily on week days.
Initial download of the metrics may take a while.