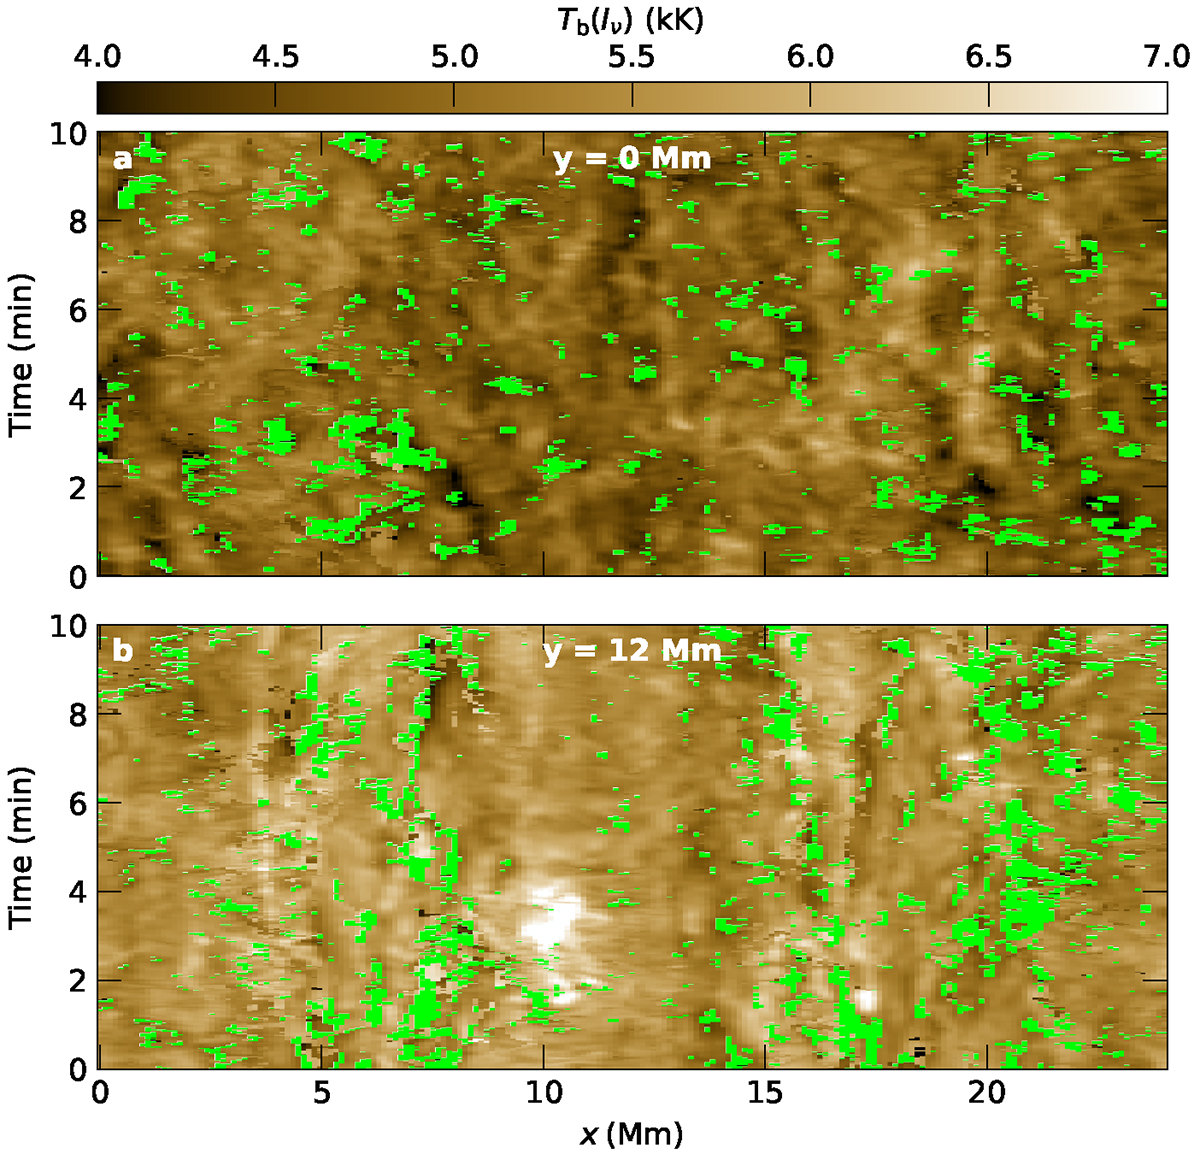
Fig. 8.
Download original image
Space–time intensity maps. The panels show the time variation (vertical axis) of brightness temperature measured at k2r along two spatial slits (horizontal axis) located at the positions y = 0 Mm (panel a) and 12 Mm (panel b). The spectra were degraded before the peak-finding algorithm was applied. Panel a represents the quieter regions of the simulation domain. Panel b represents a cut through the network-dominated regions of the simulation. The color scale is set to the same limits as in Fig. 2. Green pixels indicate spectra where no k2r feature could be detected.
Current usage metrics show cumulative count of Article Views (full-text article views including HTML views, PDF and ePub downloads, according to the available data) and Abstracts Views on Vision4Press platform.
Data correspond to usage on the plateform after 2015. The current usage metrics is available 48-96 hours after online publication and is updated daily on week days.
Initial download of the metrics may take a while.