Fig. 2.
Download original image
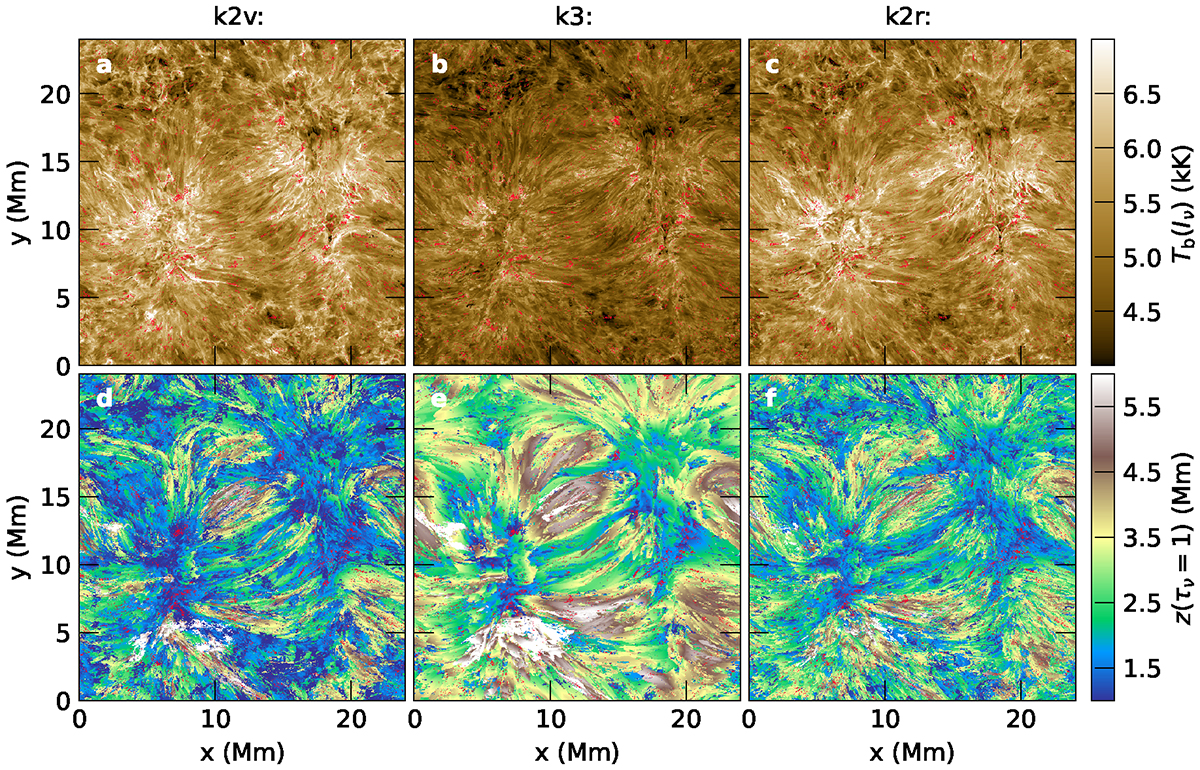
Intensity and formation height at selected spectral features of the Mg II k line. The top panels show the brightness temperature at k2v (panel a), k3 (panel b), and k2r (panel c) as classified by the peak-finding algorithm. The bottom panels show the height at an optical depth of unity at the wavelength of k2v (panel d), k3 (panel e), and k2r (panel f). Red pixels indicate those where no feature could be detected. The data correspond to the non-degraded muram_en_499000_379s snapshot.
Current usage metrics show cumulative count of Article Views (full-text article views including HTML views, PDF and ePub downloads, according to the available data) and Abstracts Views on Vision4Press platform.
Data correspond to usage on the plateform after 2015. The current usage metrics is available 48-96 hours after online publication and is updated daily on week days.
Initial download of the metrics may take a while.