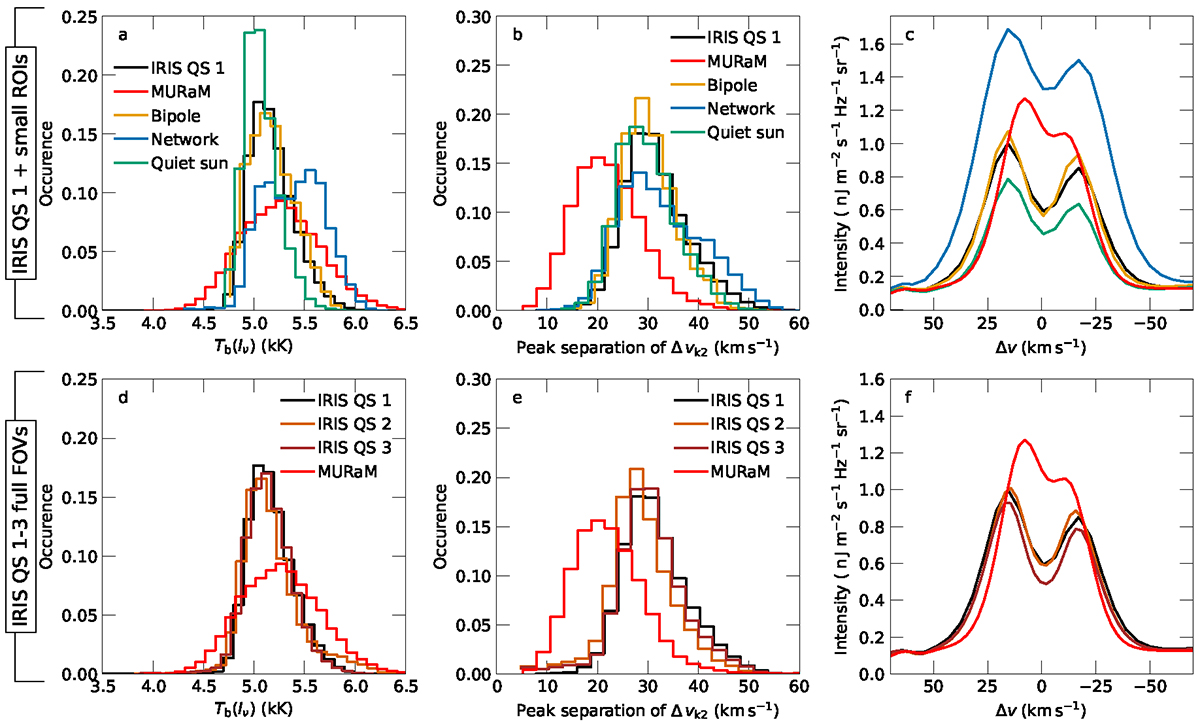
Fig. A.2.
Download original image
Comparison between statistical properties of three IRIS datasets, representing quiet sun and network regions, and the MURaM-ChE model. Panels (a), (b), (d), and (e) show distributions of k2 brightness temperature and peak separation. Panels (c) and (f) show average profiles of the Mg II k line. In panels (a–c) we compare results from the first IRIS dataset "IRIS QS 1" considering the full FOV together with smaller ROIs of roughly the size of the simulation domain with the results from the MURaM-ChE model. In panels (d–f) we compare three IRIS datasets considering the whole FOVs together with results from the MURaM-ChE model.
Current usage metrics show cumulative count of Article Views (full-text article views including HTML views, PDF and ePub downloads, according to the available data) and Abstracts Views on Vision4Press platform.
Data correspond to usage on the plateform after 2015. The current usage metrics is available 48-96 hours after online publication and is updated daily on week days.
Initial download of the metrics may take a while.