Fig. A.1.
Download original image
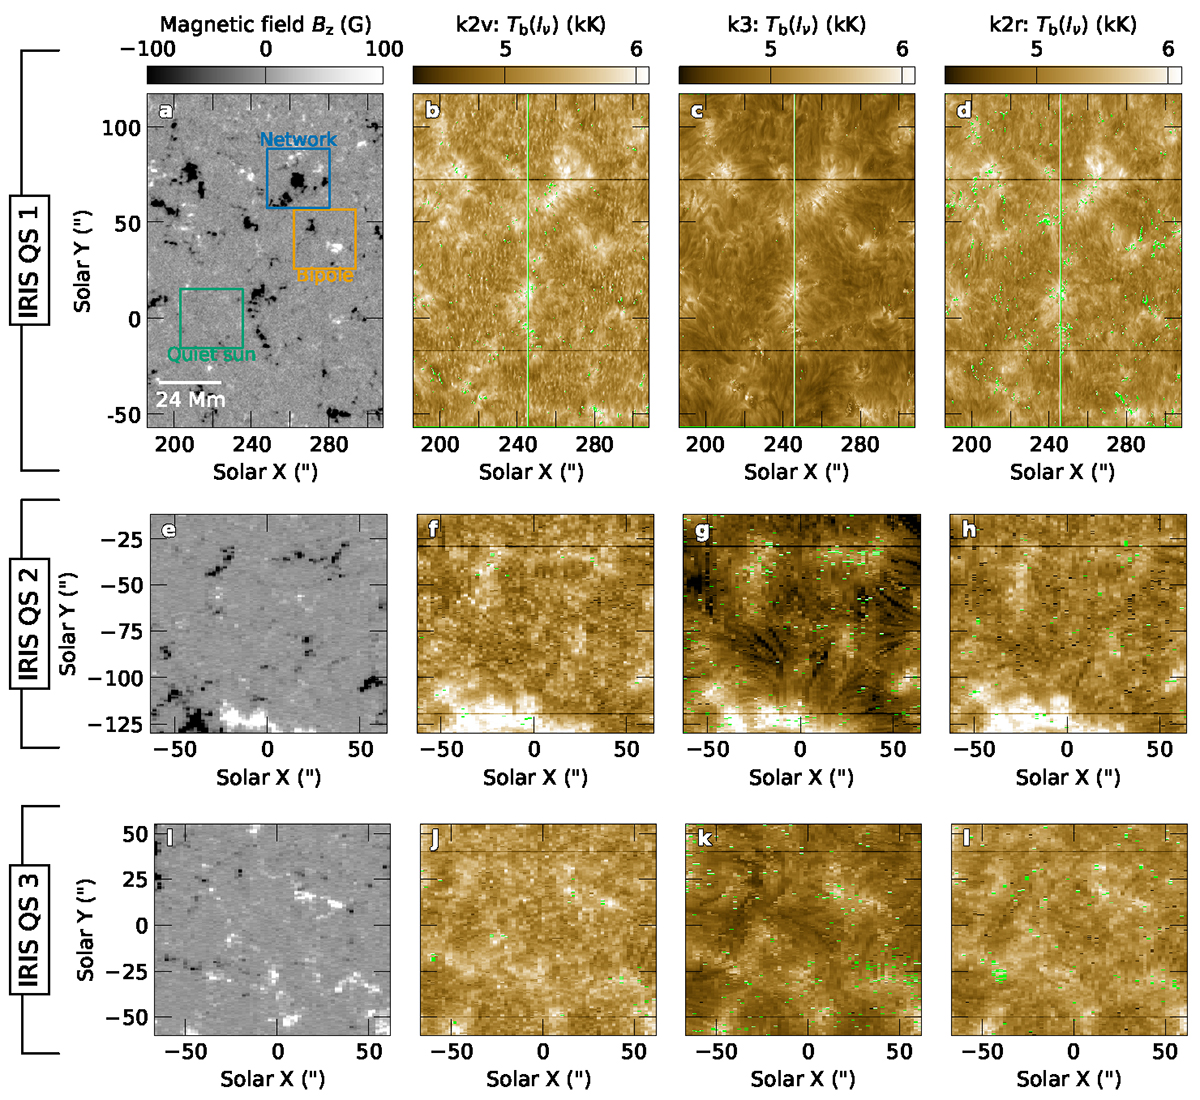
Comparison between three IRIS datasets representing quiet sun and network regions. The first dataset "IRIS QS 1" (panels a–d) is the same as the one shown in main text. Three boxes of roughly similar size as the MURaM-ChE model are shown in panel (a). The second and third dataset are shown in panels (e–h, IRIS QS 2) and panels (i–l, IRIS QS 3). Panels (a,e,i) show the LOS magnetic field strength measured by the HMI. Panels (b,f,j) show the brightness temperature Tb at the k2v, panels (c,g,k) at the k3 and panels (d,h,l) at the k2r feature. Green colored pixels indicate where no feature could be detected.
Current usage metrics show cumulative count of Article Views (full-text article views including HTML views, PDF and ePub downloads, according to the available data) and Abstracts Views on Vision4Press platform.
Data correspond to usage on the plateform after 2015. The current usage metrics is available 48-96 hours after online publication and is updated daily on week days.
Initial download of the metrics may take a while.