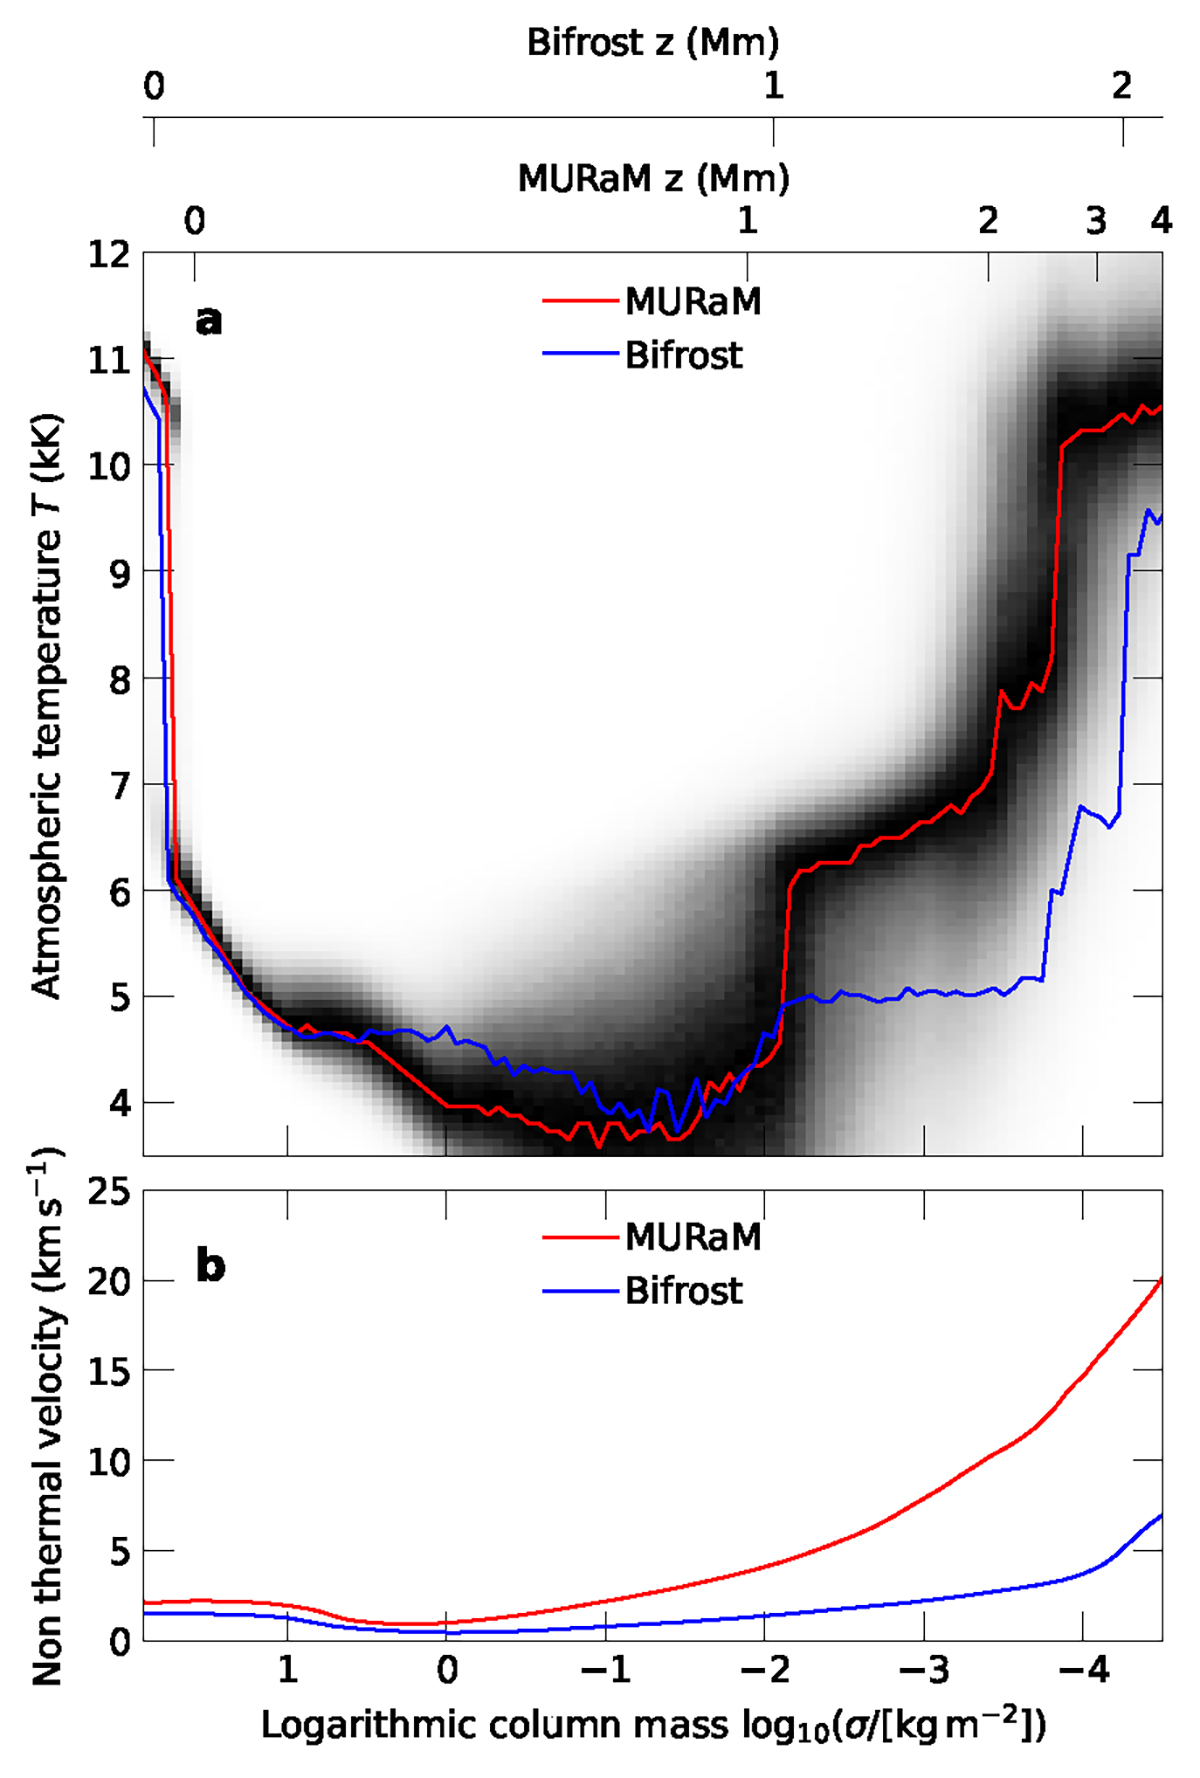
Fig. 11.
Download original image
Comparison between atmospheric properties between the MURaM-ChE and the Bifrost public snapshot. Panel a: Atmospheric temperature as a function of column mass σ. The two curves show the peak of the temperature distribution of the atmospheres in a given bin of column mass. For MURaM-ChE we show the distribution of the temperature as a 2D histogram which is normalized to the peak of the distribution in a given bin of logarithmic column mass. For both simulations we converted the column mass scale to a geometrical height that is shown on the top horizontal axis of the plot. Panel b: Average nonthermal velocity as function of column mass. The nonthermal velocity is computed as the standard deviation of the vertical velocity within a range of ±1 dex in logarithmic column mass and multiplied by a factor of ![]() .
.
Current usage metrics show cumulative count of Article Views (full-text article views including HTML views, PDF and ePub downloads, according to the available data) and Abstracts Views on Vision4Press platform.
Data correspond to usage on the plateform after 2015. The current usage metrics is available 48-96 hours after online publication and is updated daily on week days.
Initial download of the metrics may take a while.