Open Access
Fig. 7
Download original image
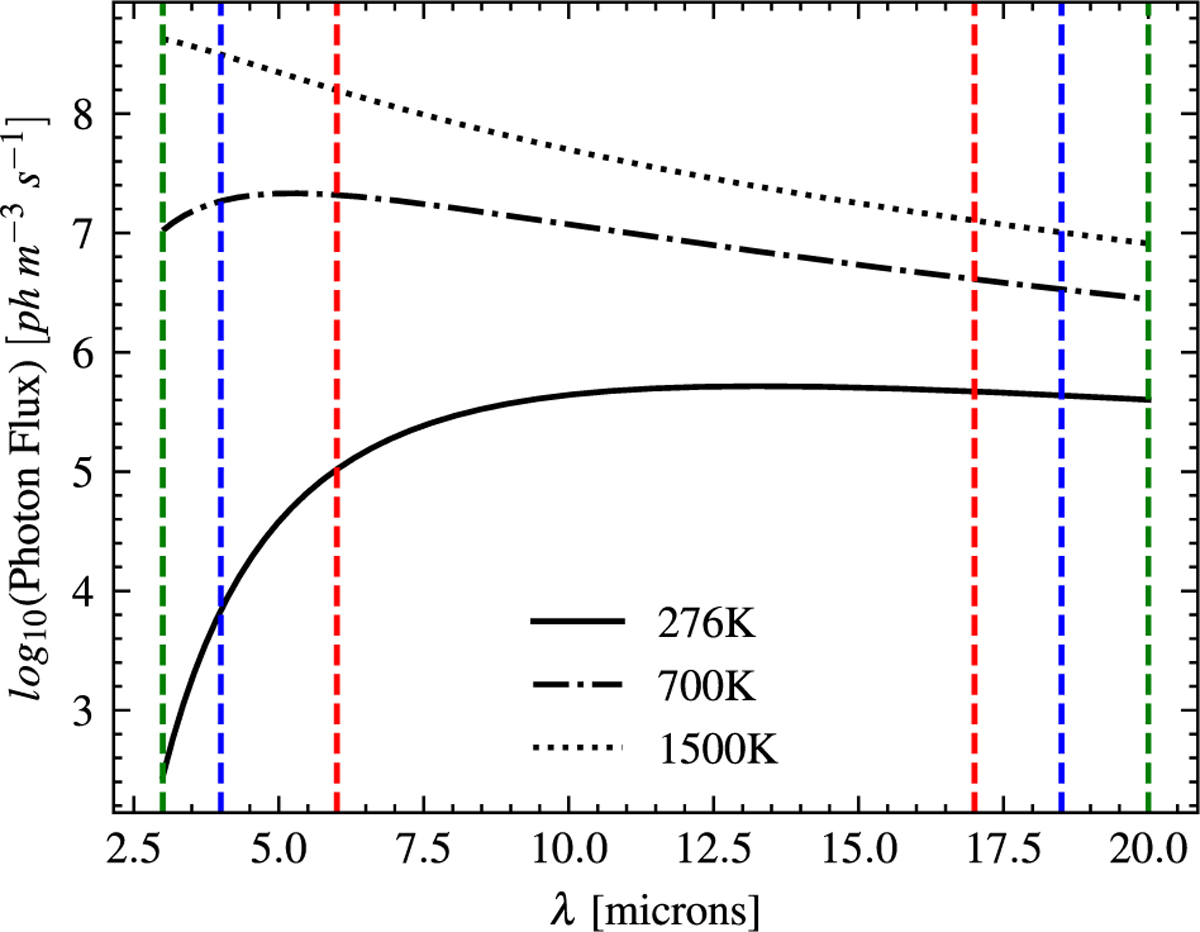
Photon flux emitted by a blackbody against the wavelength (microns). Blackbody curves of three planets at 276, 700, and 1500 K respectively. The vertical lines represent the wavelength ranges considered for the PESSIMISTIC (red), BASELINE (blue), and OPTIMISTIC (green) LIFE scenarios.
Current usage metrics show cumulative count of Article Views (full-text article views including HTML views, PDF and ePub downloads, according to the available data) and Abstracts Views on Vision4Press platform.
Data correspond to usage on the plateform after 2015. The current usage metrics is available 48-96 hours after online publication and is updated daily on week days.
Initial download of the metrics may take a while.