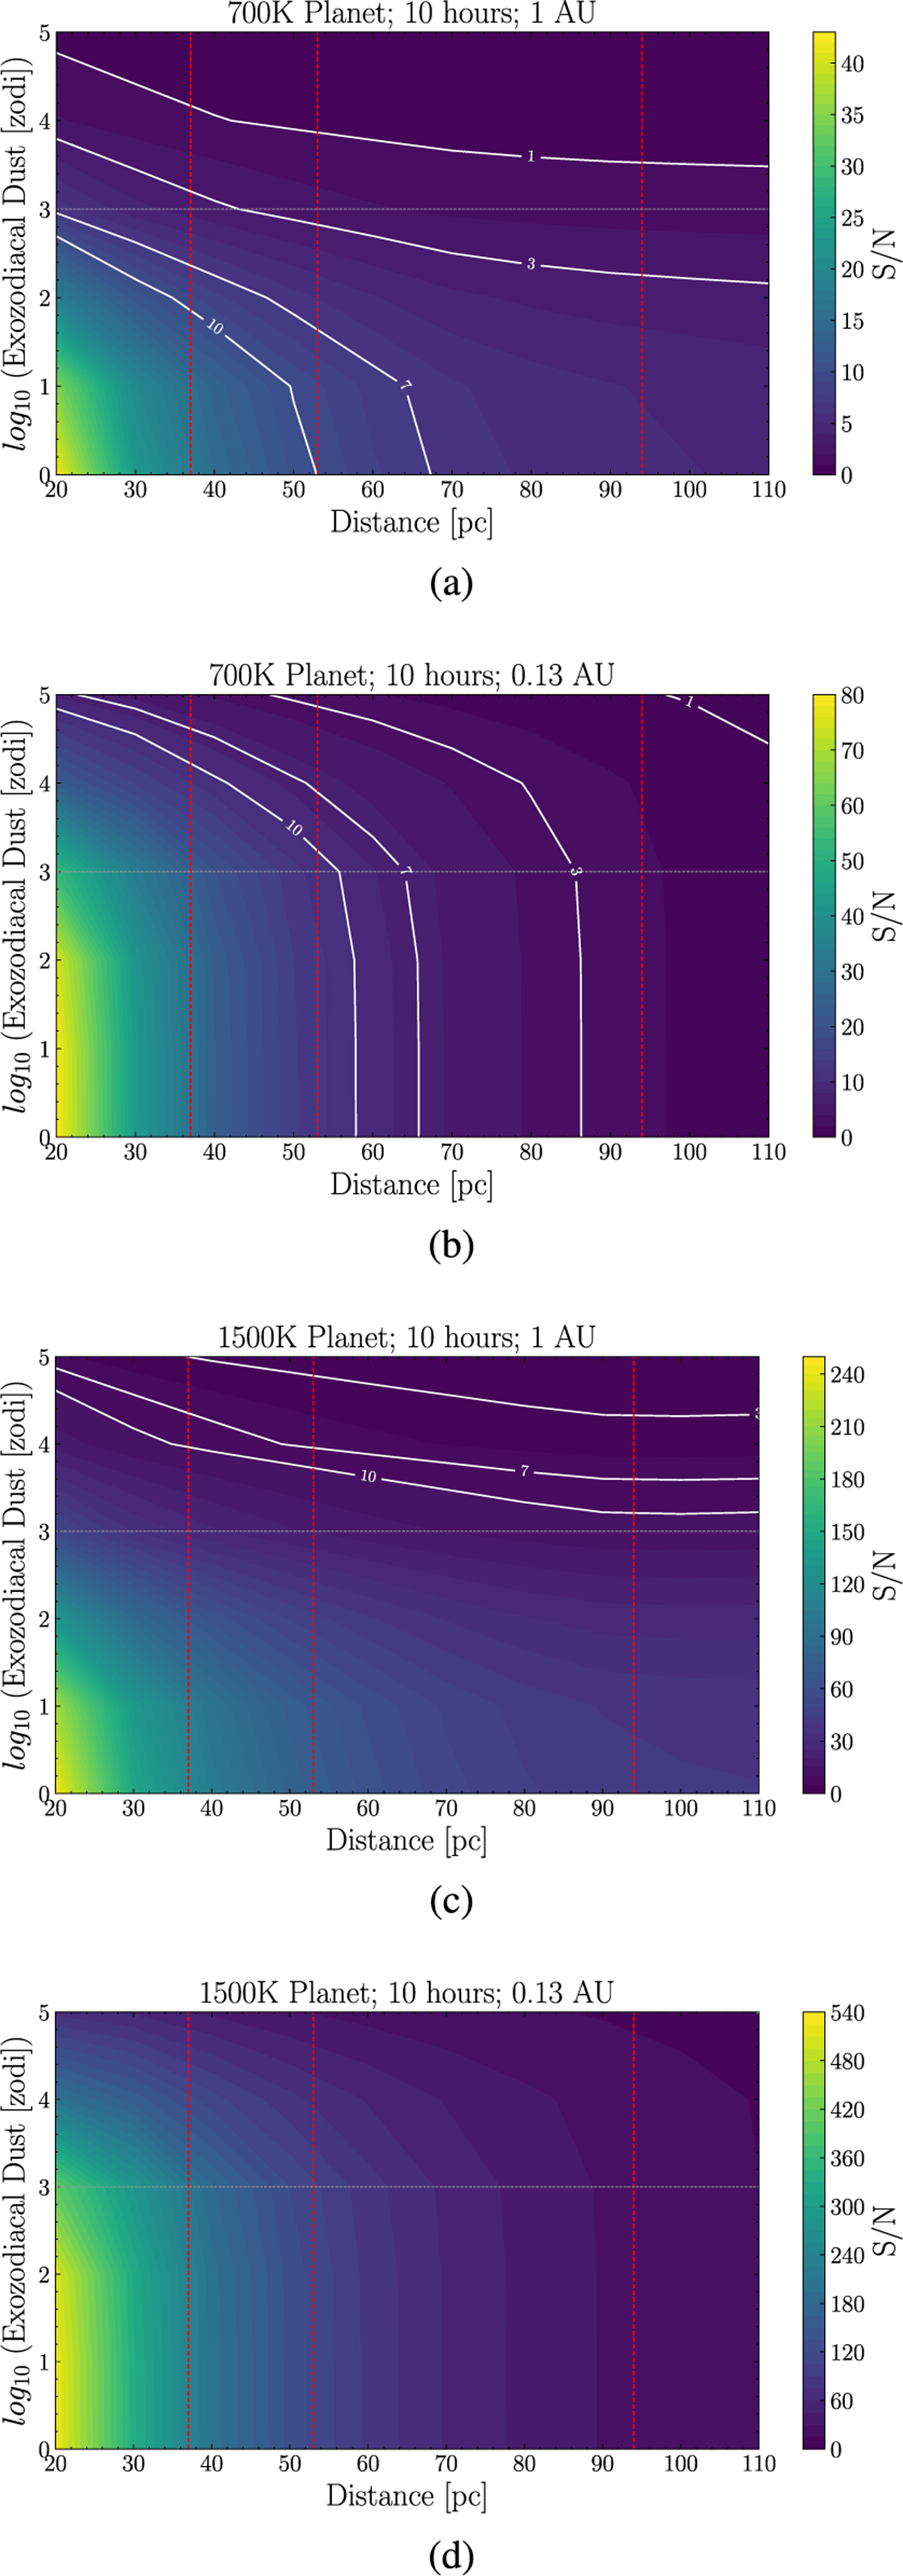
Fig. 12
Download original image
Resulting S/N obtained after observation of a planet in a system with different exozodi dust levels. All four plots are obtained with 10 hours of integration time and for observation of a planet in the farthest stellar association η Chamaeleontis. Plots (a) and (b) are observations for a moderate temperature case, 700 K, (c) and (d) are for a 1500 K scenario. For each temperature case, the first plot is for a planet orbiting a Sun-like star at 1 AU, the second is for an M-dwarf at 0.13 AU. The red vertical lines indicate the distances of β Pictoris, TW Hydrae, and η Chamaeleontis, respectively.
Current usage metrics show cumulative count of Article Views (full-text article views including HTML views, PDF and ePub downloads, according to the available data) and Abstracts Views on Vision4Press platform.
Data correspond to usage on the plateform after 2015. The current usage metrics is available 48-96 hours after online publication and is updated daily on week days.
Initial download of the metrics may take a while.