Fig. 5
Download original image
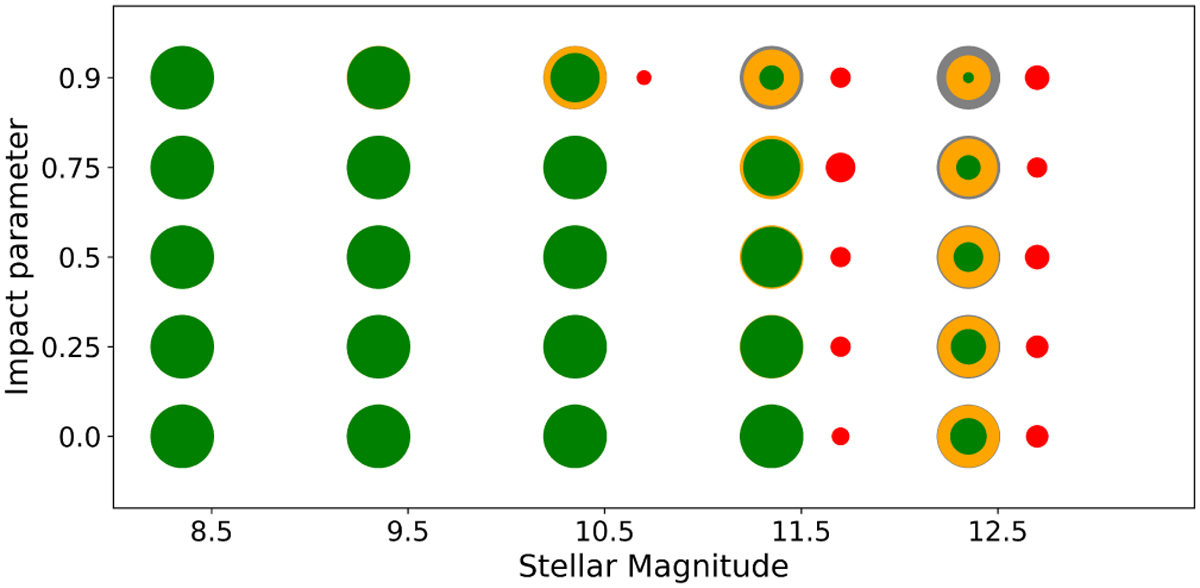
Overview of detections and false positives of the transit search algorithm as a function of the stellar magnitude and impact parameter. Grey circles mark the number of injected transit events, green circles the number of correct detections, orange circles the number of events where at least one of the two injected transits was detected, and red circles the number of unique false positives. Numbers are proportional to the area of a circle.
Current usage metrics show cumulative count of Article Views (full-text article views including HTML views, PDF and ePub downloads, according to the available data) and Abstracts Views on Vision4Press platform.
Data correspond to usage on the plateform after 2015. The current usage metrics is available 48-96 hours after online publication and is updated daily on week days.
Initial download of the metrics may take a while.