Fig. 3.
Download original image
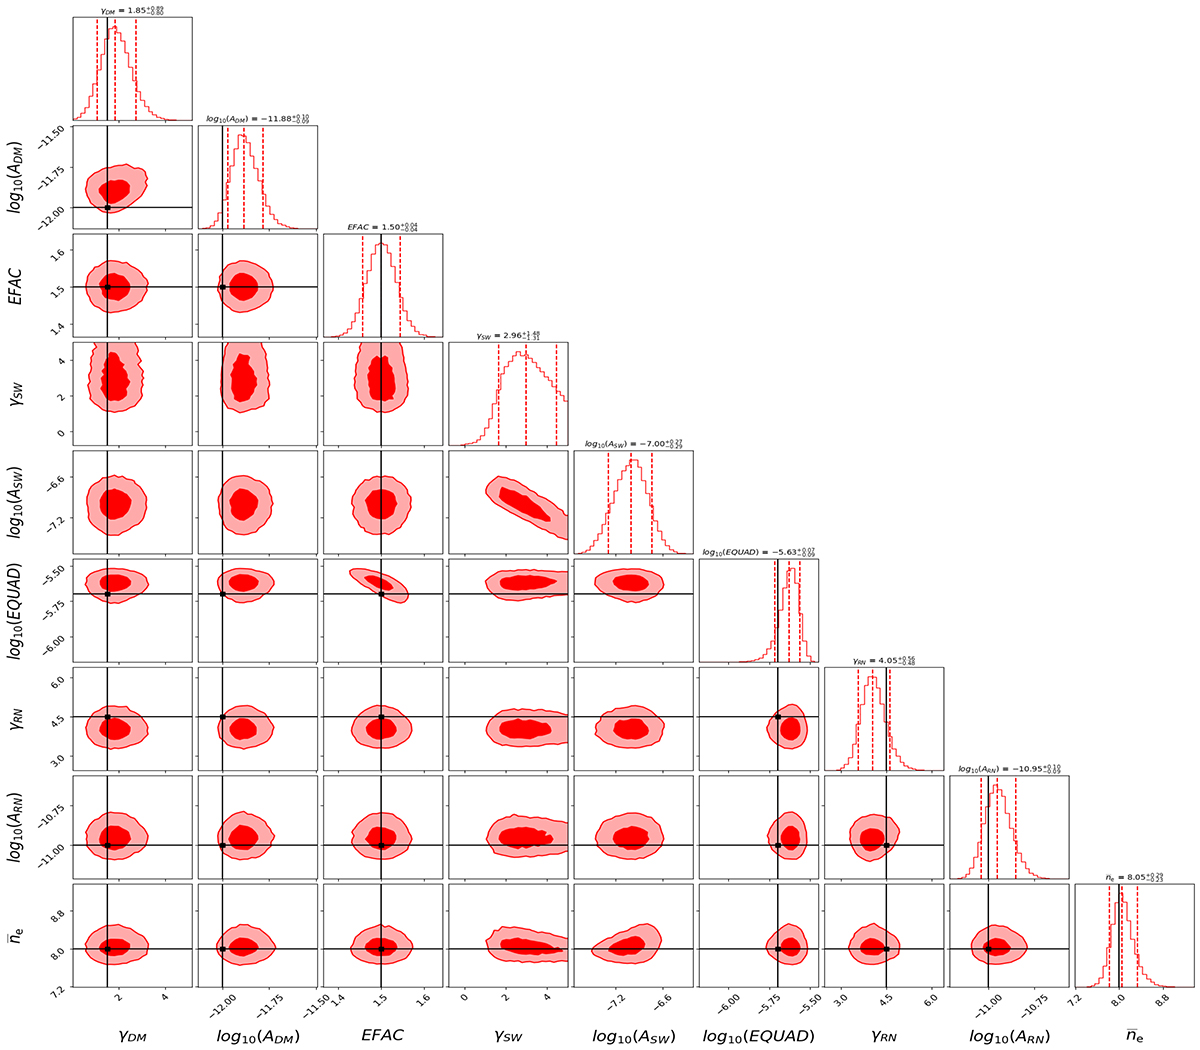
Simulation scenario 2, with noise. Posterior chain plot for yearly varying ne scenario. The black lines represent the truth values injected into the simulations. The black line in ![]() box is the average value of
box is the average value of ![]() across a period of four years. The red lines in the histograms represent the 3σ error from the maximum likelihood value.
across a period of four years. The red lines in the histograms represent the 3σ error from the maximum likelihood value.
Current usage metrics show cumulative count of Article Views (full-text article views including HTML views, PDF and ePub downloads, according to the available data) and Abstracts Views on Vision4Press platform.
Data correspond to usage on the plateform after 2015. The current usage metrics is available 48-96 hours after online publication and is updated daily on week days.
Initial download of the metrics may take a while.